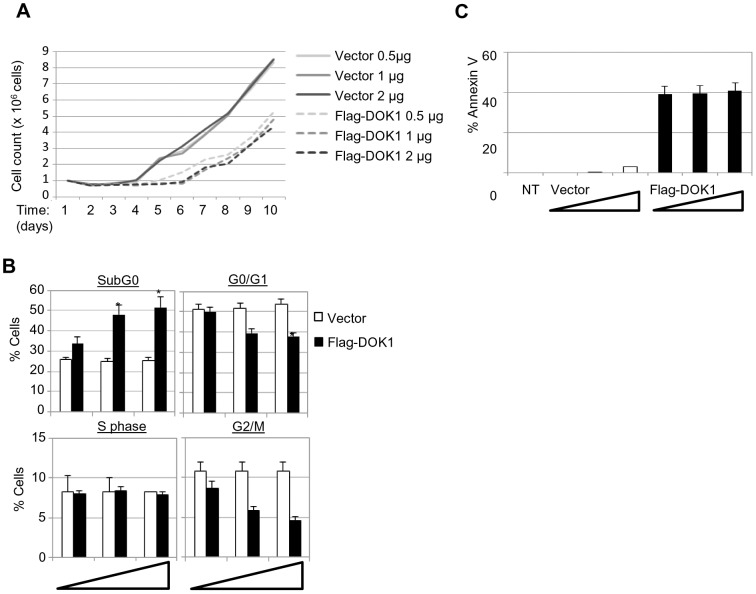
Figure 6. (A) LCL cells were transfected with the indicated amounts of empty pcDNA3 (Vector) or expression vector pcDNA3-Flag-DOK1.
After 24(B) LCL cells were monitored for cell cycle analysis 48 hours after being transfected with the indicated amounts of pcDNA3 empty (Vector) or expression vector pcDNA3-Flag-DOK1. Cells in different cycle phases (SubG0, G0/G1, S, or G2/M) are represented as percentage of total cells. (C) The same cells from (B) were monitored for apoptosis using Annexin V staining. Non transfected cells were used as control (NT). Error bars indicate the SD from two independent experiments. Data were analyzed using Student's t test (*, P<0.05).

