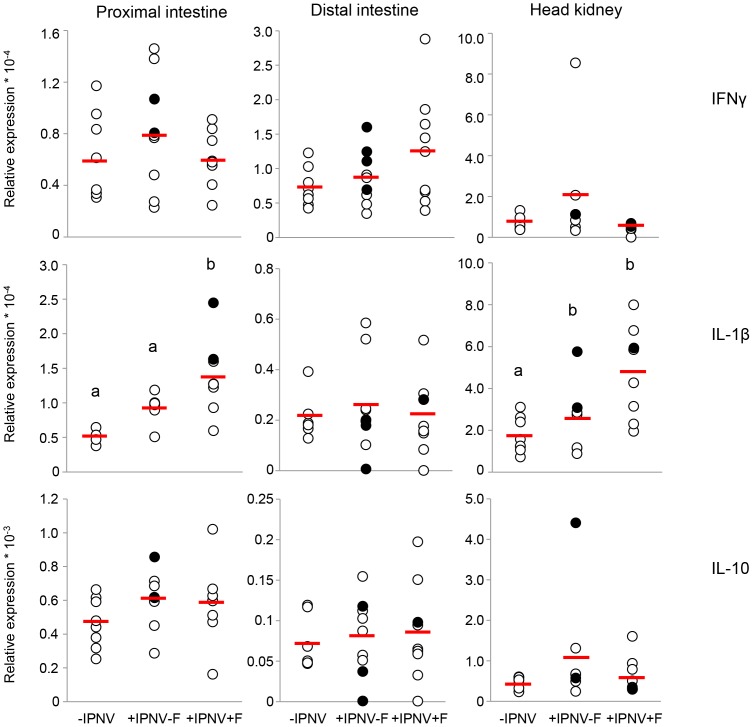
Figure 6. mRNA expression of IL-1β, IFNγ and IL-10 6 days post-challenge.
mRNA expression of IL-1β in the proximal intestine (n = 4, 7, 8), distal intestine (n = 7, 9, 9) and in the head kidney (n = 8, 7, 8), mRNA expression of IFNγ in the proximal intestine (n = 8, 9, 8), distal intestine (n = 8, 9, 9) and in the head kidney (n = 7, 7, 8) and mRNA expression of IL-10 in the proximal intestine (n = 8, 9, 8), distal intestine (n = 7, 9, 9) and in the head kidney (n = 8, 7, 8). The VP1 positive fish 6 days post-challenge is presented as filled circles and the red line corresponds to the average value of the treatment group. Different letters denote statistically significant differences among the groups according to Tukeýs post hoc test. Statistical significance was accepted at p<0.05.

