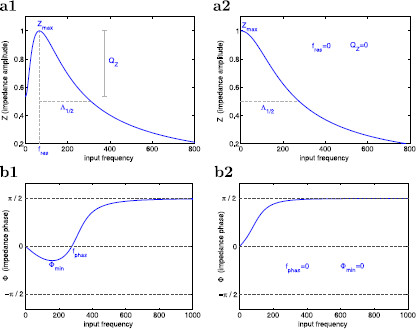
Fig. 2.

Schematic diagrams of the impedance (a) and phase (b) profiles (impedance and phase as a function of the input frequency f). a1 Band-pass filter (resonance). a2 Low-pass filter (no resonance). b1 Zero-frequency phase crossing (phase-resonance). b2 Monotonically increasing and positive phase (no phase-resonance). a The resonant frequency is the input frequency f at which the impedance reaches its maximum . The resonance amplitude measures the resonance power. The half-width frequency band is the length of the frequency interval in between and the input frequency value at which , and measures the system’s selectivity to incoming frequencies close to . b The phase-resonant frequency is the zero-crossing phase frequency. The minimum phase measures the magnitude of the negative phase
