
Fig. 9.
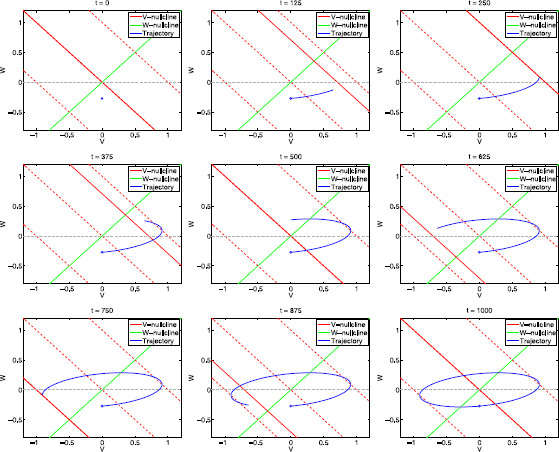
Snapshots of the moving phase-plane diagram for the linear system (29)–(30) for , , and representative values of t within one cycle (). The solid-red lines represent the moving v-nullcline. The dashed-red lines represent the v-nullclines for (middle), (top), and (bottom). The solid-green line represents the (fixed) w-nullcline. The fixed solid-red line and the solid-green line represent the v- and w-nullclines for the unforced system (), respectively. The dashed-red lines represent the v-nullclines for (above), (middle), and (below). As t increases, the red nullcline moves cyclically between the two dashed-red lines. The blue dot indicates the initial location of the trajectory ()