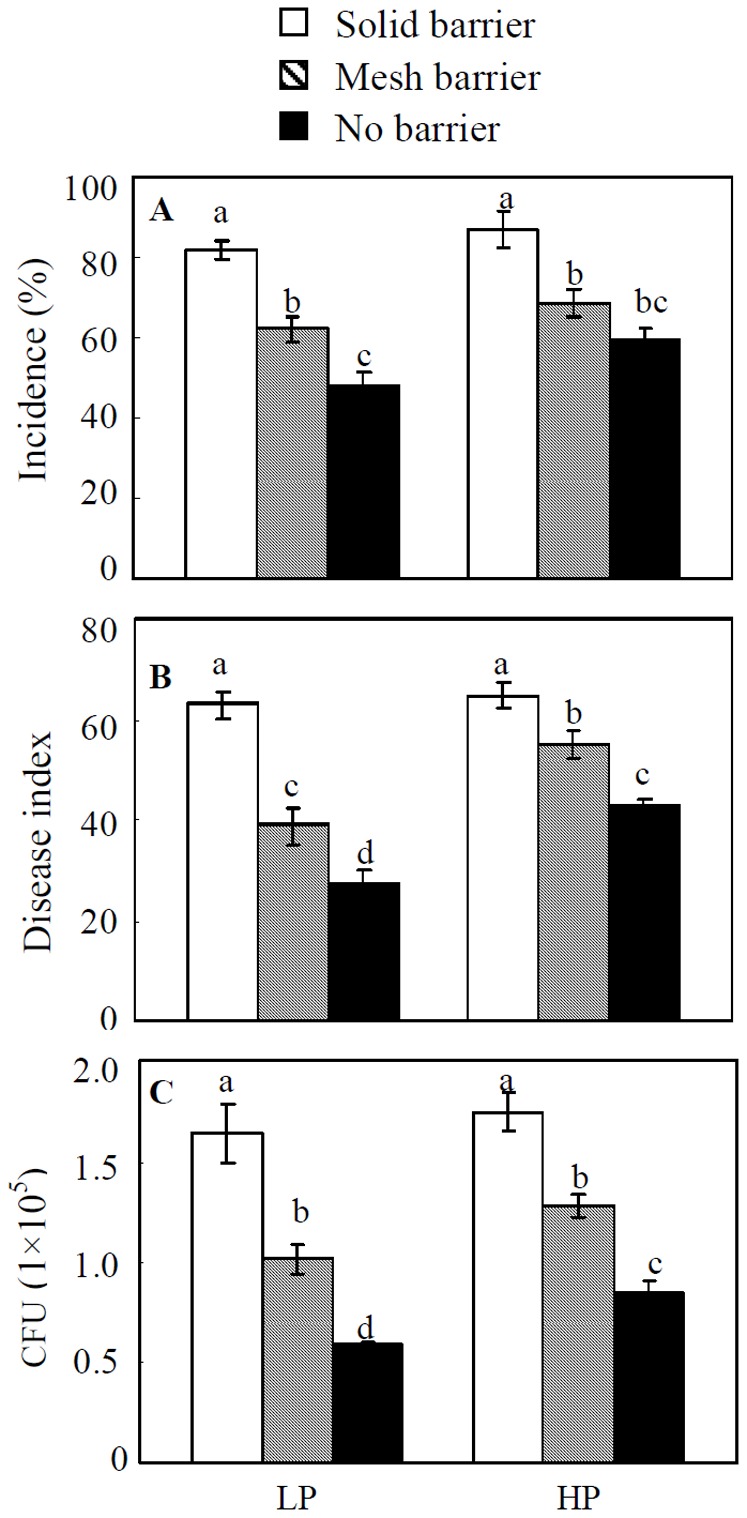
Figure 2. Disease severity of soybean red crown rot in sand culture.

A, disease incidence, B, disease index, C, CFU. LP, 15 µM P; HP, 500 µM P. All of the data are the means of four replicates ±SE. Bars with different letter(s) vary significantly among the different inoculation treatments as determined by Duncan's multiple range test (P<0.05).
