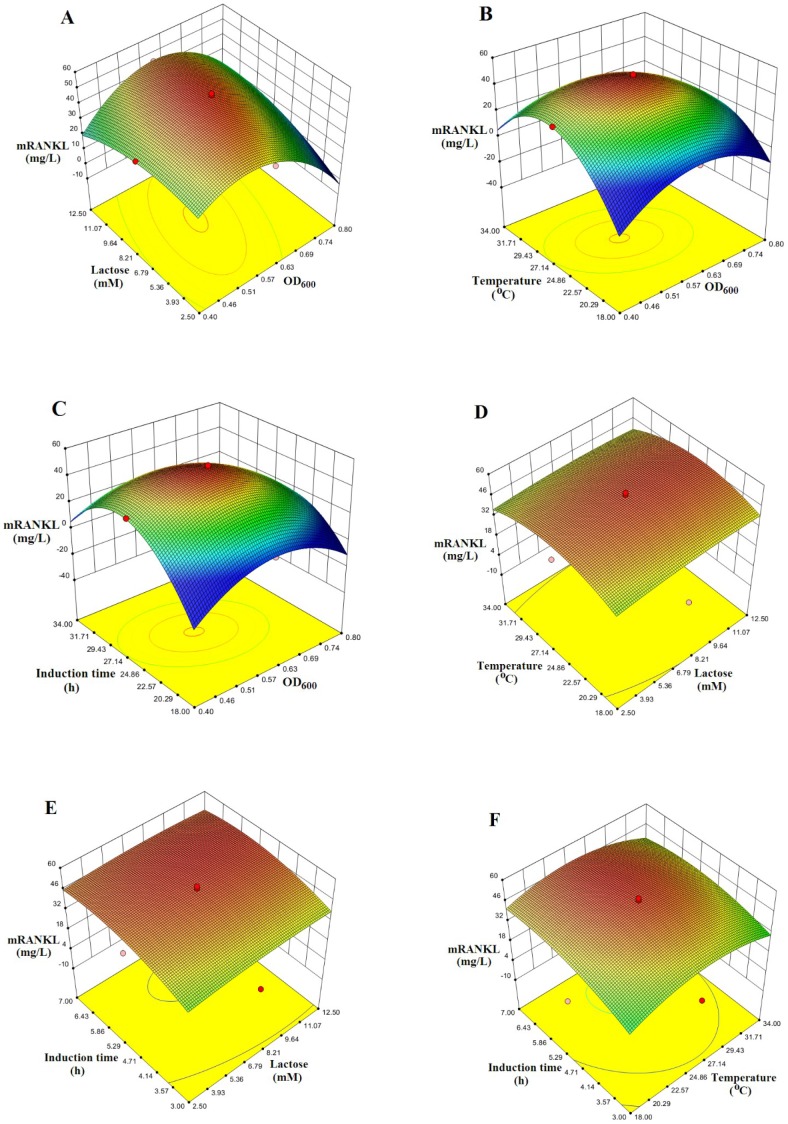
Figure 2. Response surface plots to visualize the relationship between the response and experimental levels of each factor.
Three dimensional surface plots of combined effect of cell density (OD600) and lactose concentration (A), OD600 and post-induction temperature (B), OD600 and post-induction time (C), post-induction temperature and lactose concentration (D), post-induction time and lactose concentration (E) and post- induction temperature and post-induction time (F) on mRANKL production.

