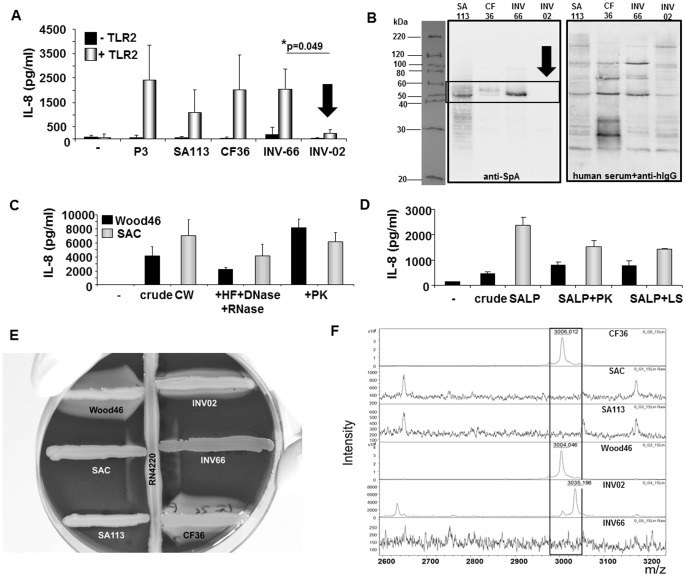
Figure 4. Protein A expression correlates with TLR2-activity.
A: Comparison of TLR2-induced IL-8 secretion levels after stimulation of HEK293 cells transfected with 200 ng/well of pTLR2 with SA113, clinical S. aureus isolates (CF36, INV66, INV02), 1 µg/ml Pam3CSK4 (P3) or when left unstimulated (−). B: Comparison of SpA expression in SA113 and clinical S. aureus isolates (CF36, INV66, INV02). Left: Western blot analysis of SpA expression in bacterial lysates using anti-SpA mAb and anti-murine IgG-HRP. Right: Control blot incubated with human serum and biotinylated anti-human IgG-+ streptavidin-HRP to visualize protein loading. One representative experiment of n ≥ 3 experiments is shown. C+D: Stimulation of TLR2-transfected HEK293 cells with 5 µg/ml cell wall (CW; C) or lipoprotein preparations (SALP; D) prepared from S. aureus strains Cowan I (SAC; SpAhigh, grey bars) or Wood46 (SpAlow, black bars). As indicated crude CW (left) were treated with hydrofluoric acid (HF) and RNAse A and DNAse I (middle) followed by digestion with proteinase K (PK, right). SALP were treated with proteinase K (PK, left) or lysostaphin (LS, right). (−) refers to unstimulated cells. The experiments shown were performed in triplicates and show mean values ± SEM of IL-8 concentrations determined in the supernatants. They are representative of n = 2 independent experiments. E+F: Analysis of agr activity. E: Hemolysin production. Strains to be tested for hemolysin production were cross-streaked to RN4220, which produces β-hemolysin. After incubation for 36 hours strains were analyzed following the description by Taber et al. [15]: Wood46 and CF36 displayed the typical pattern for α- and δ-hemolysin expression, INV02 produced α-, β- and δ-hemolysins, SAC (Cowan I) and INV66 expressed only low amounts of δ-hemolysin and SA113 was negative for α-, β- and δ-hemolysins. In conclusion, SA113, SAC and INV66 were categorized as agr-, Wood46, CF36 and INV02 were typed as agr+. F: Analysis of δ-toxin expression by MALDI-TOF. δ-toxin expression is dependent on agr activity as reported in [17]. Delta toxin (MW 3007) and delta toxin G10S (MW 3037) peaks were detectable in Wood46, INV002 and CF36 and absent in SAC, SA113 and INV66.

