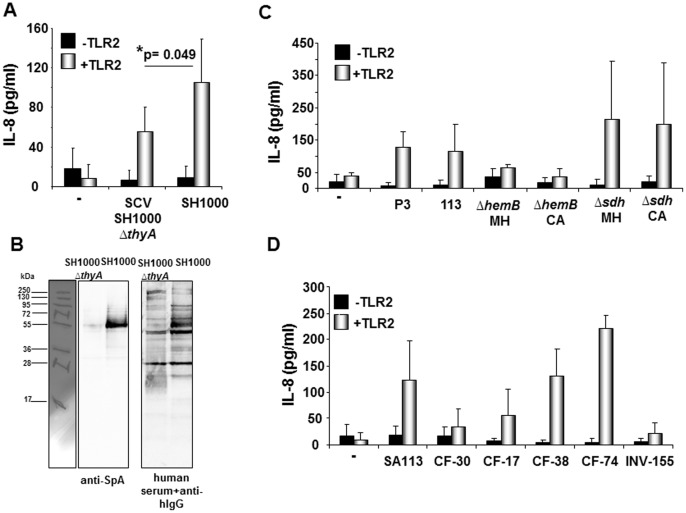
Figure 5. SCV formation can be associated with reduced TLR2-activity.
A,C and D: HEK293 cells were transfected with or without TLR2 cDNA (100 ng/well in A+D or 200 ng/well in C) and stimulated with S. aureus strains for 18–20 hours. IL-8 secretion was quantified as indicator of TLR2 activation. All diagrams show the results obtained in three independent experiments given as mean values ± SD (standard deviation). A: Stimulation of HEK293 cells w/o pTLR2 with S. aureus SH1000 and its isogenic thymidine-auxotrophic mutant SCV SH1000 ΔthyA; *p(SH1000:ΔthyA) = 0.049. B: Comparison of SpA expression in SH1000 (TLR2high) and its isogenic SCV SH1000 ΔthyA (TLR2low). Left: Western blot analysis of SpA expression in bacterial lysates using anti-SpA mAb and anti-murine IgG-HRP as secondary antibody. Right: Control blot incubated with human serum and biotinylated anti-human IgG+streptavidin-HRP. One representative experiment of n = 3 experiment is shown. C: HEK293 cells w/o TLR2 were stimulated with SA113 or its mutants ΔhemB and Δsdh (grown on Mueller Hinton (MH) or Columbia agar (CA)) or with 1 µg/ml of the TLR2 ligand Pam3CSK4 (P3) or left unstimulated (−). D: Stimulation with five different clinical S. aureus SCV (isolate source: CF = cystic fibrosis, INV = invasive) and SA113. (−) = unstimulated.

