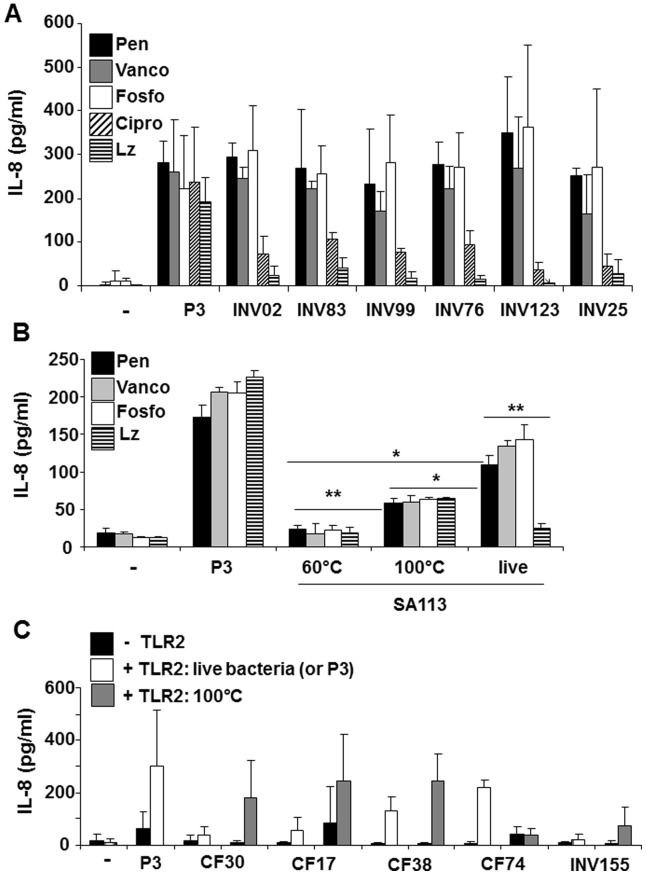
Figure 6. Disruption of cell wall integrity facilitates recognition of TLR2 ligands.
A+B: HEK293 cells transfected with 100 ng/well of TLR2 plasmid were stimulated with clinical S. aureus isolates (A) or with heat-inactivated, boiled or live SA113 (B) and compared to Pam3CSK4 (P3; 0.2 µg/ml (A); 1 µg/ml (B)) and to unstimulated cells (−). Stimulation was carried out in the presence of different antibiotics: penicillin (Pen), vancomycin (Vanco), fosfomycin (Fosfo), ciprofloxacin (Cipro) or linezolid (Lz). S. aureus isolates were susceptible to all antibiotics tested. The diagrams shown provide the mean values ± SD of IL-8 values summarized from n = 3 independent experiments. The most relevant statistical results are highlighted as (*) or (**): Penicillin: *p (live:100°C) = 0.03, *p (live:60°C) = 0.01, **p (100°C: 60°C) = 0.001 and **p (live+Pen: live+Lz) = 0.002; not indicated: Vancomycin: **p (live:100°C) = 0.001; Linezolid: *p(live:100°C) = 0.006. C: HEK293 cells transfected with (white or grey bars) or without (black bars) 100 ng/well of TLR2 plasmid were stimulated with clinical SCV strains, 0.2 µg/ml of Pam3CSK4 (P3) or left unstimulated. Live bacteria (white bars) were compared to crude preps (boiled bacterial suspensions; grey bars). IL-8 levels in the supernatants were determined to quantify TLR2-activity. The diagram shows the mean values ± SD obtained in three independent experiments.

