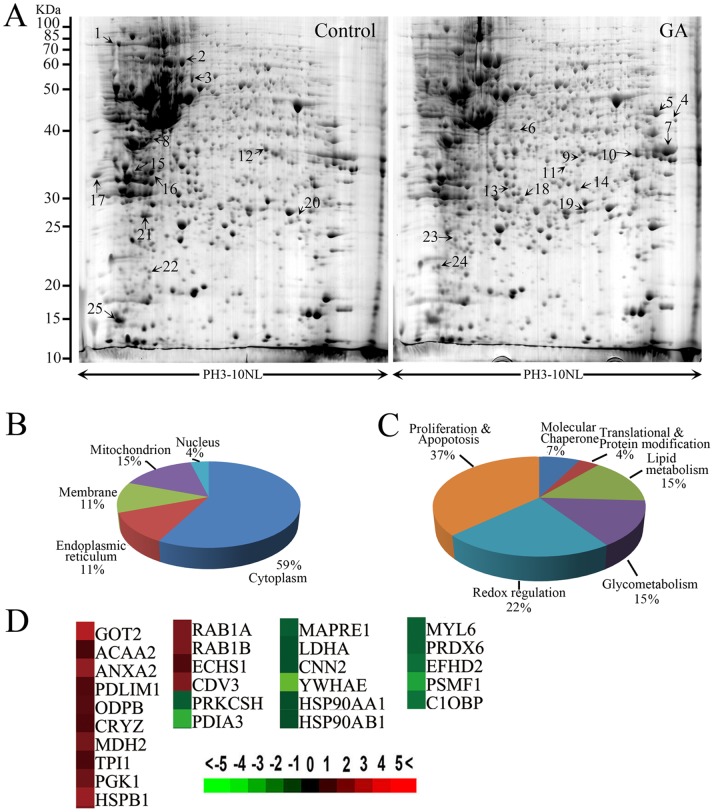
Figure 5. Redox dysregulation was induced upon GA treatment.
(A) Representative two-dimensional gel images of the control and GA-treated (1 µM, 24 h) HCT116 cells. Total protein extracts were separated on pH 3–10 nonlinear immobilized pH gradient strips in the first dimension followed by 12% SDS-PAGE in the second dimension and visualized by CBB staining. (B) The identified proteins were categorized into groups according to their subcellular locations. (C) 27 distinct proteins were classified into 6 groups based on their biological functions. (D) Protein cluster map generated by cluster software. Expression of proteins in the control was constant at 0, whereas proteins upregulated in GA-treated cells are in red, and the downregulated proteins are in green. The intensity of the color green or red corresponds to the degree of alteration, respectively, according to the color strip at the bottom of the figure.

