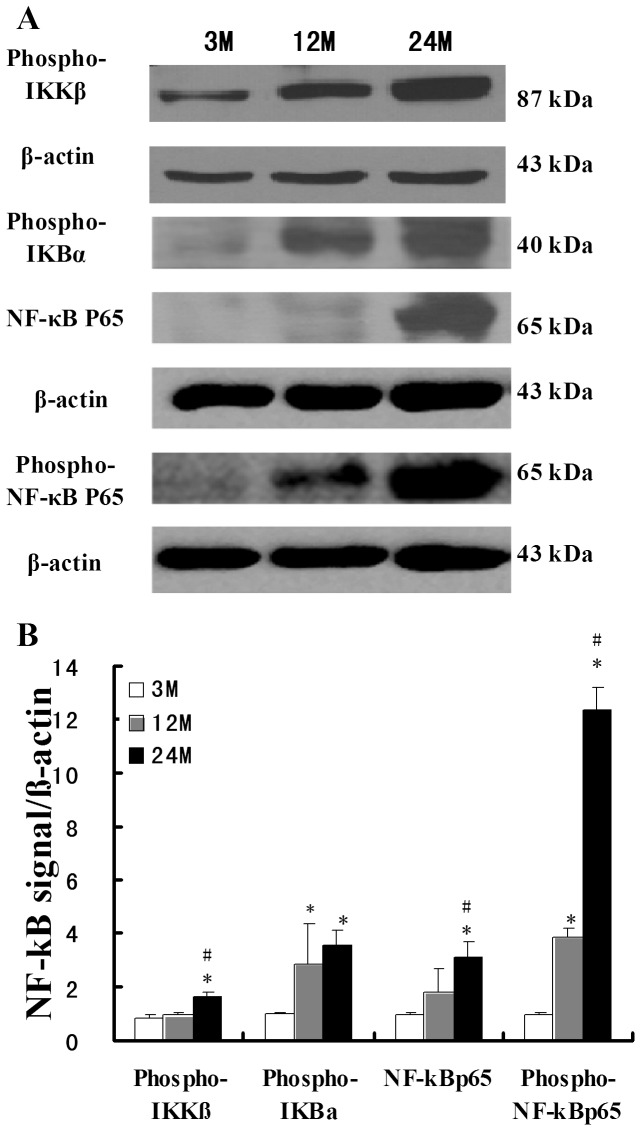
Figure 5. Expression of NF-κB signaling pathway molecules in rat kidney tissues in different age groups.
(A) Western blot detection of the expression of NF-κB signaling pathway proteins in various rat groups. (B) Quantitative analysis of gray scale. Compared with the 3-month-old group, * indicates P<0.05; compared with the 12-month-old group, # indicates P<0.05.

