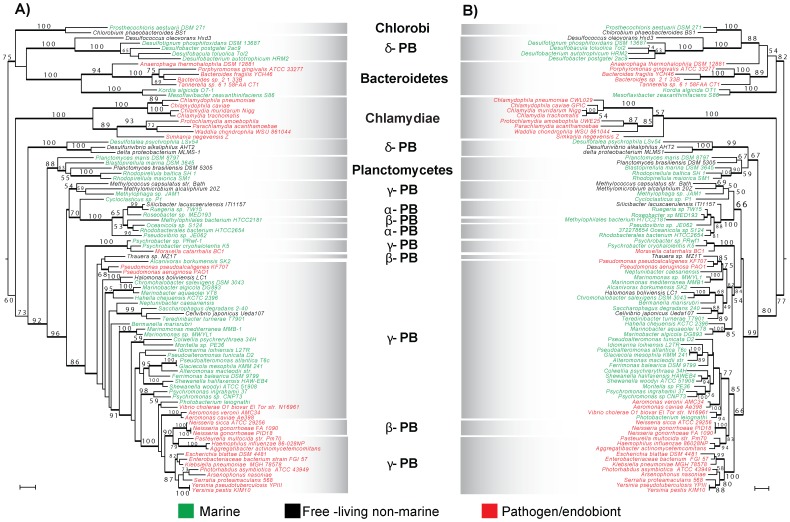
Figure 2. Maximum Likelihood phylogenetic analyses of NqrB (A) and NqrF (B) subunits of the Na+-NQR complex.
Numbers near nodes indicate RaxML bootstrap branch support values (when ≥50%) and Bayesian posterior probabilities ≥0.95. Branch lengths are proportional to the number of substitutions per site (scale bars corresponds to 0.1 substitutions per site, respectively). Major bacterial groups are highlighted with shaded boxes. Taxa in red characters are endobionts or pathogens. Organisms in green type set have been found in marine habitats and those in black characters are free-living non-marine bacteria.

