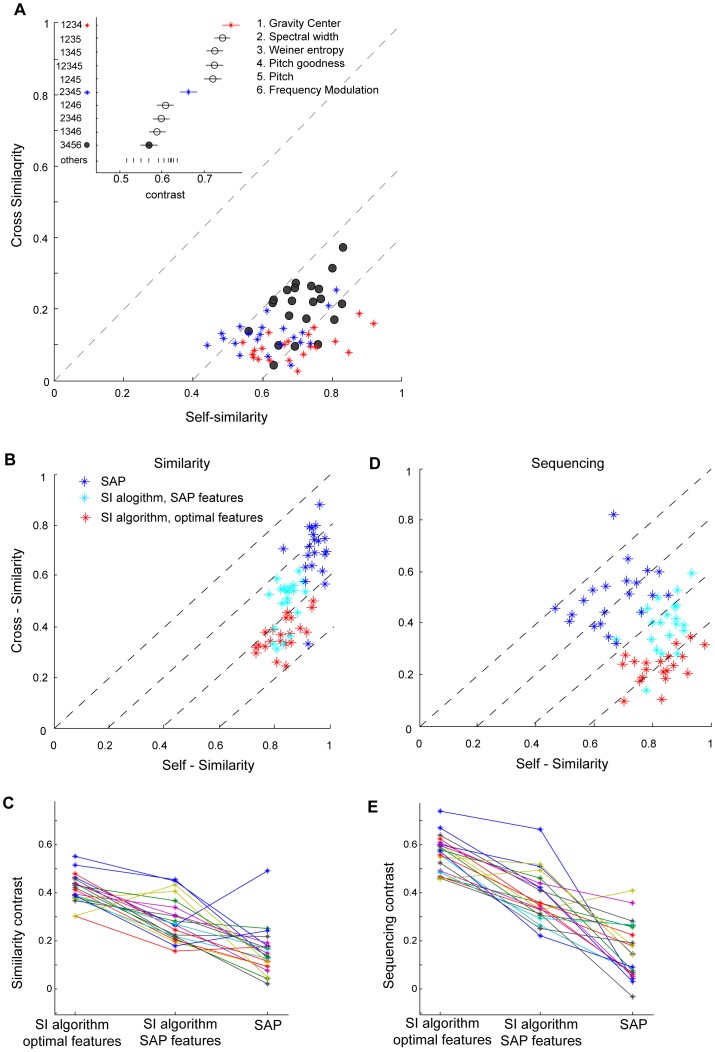
Figure 4. Comparison of different methods of measuring acoustic similarity.
A) Selecting the optimal set of features. For each bird we measured the similarity of extracted song bouts to its own song motif (self-similarity) and to the motif of other birds (cross-similarity). These were computed using different combinations of spectral features (indicated with different colors and symbols). Inset: The contrast between self-similarity and cross-similarity, shown for each different subset of features tested. B-E) The SI algorithm yields higher contrast than the SAP software. Acoustic (B) and sequence (D) self-similarity versus cross-similarity computed using the Similarity Index (SI) algorithm with the optimal features (red), using the SI algorithm with the set of features used by SAP (cyan), and using SAP software (blue). The contrast was significantly larger using the SI algorithm with optimal features, both for the acoustic similarity scores and sequence similarity scores (C and E, respectively).

