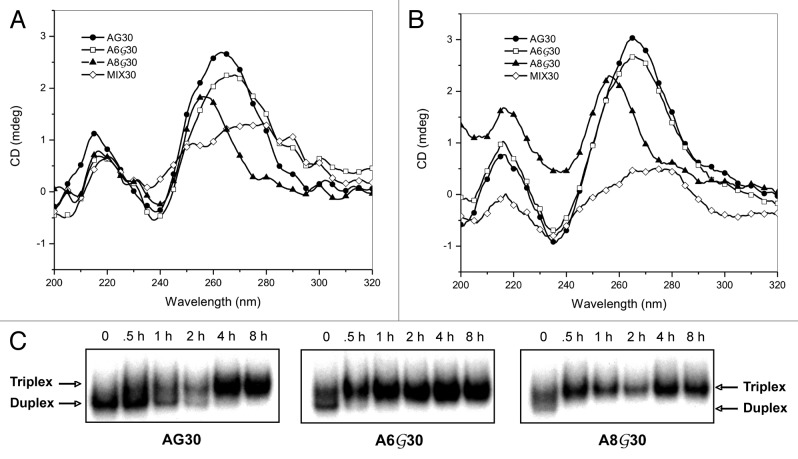
Figure 3. Potential effect of G-rich oligonucleotide self-aggregation on triplex formation. (A) CD spectra of AG30, A6G30, and A8G30 in standard triplex binding buffer (10 mM MgCl2/no K+). All spectra were collected at room temperature in a species concentration of 2μM. (B) CD spectra collected in the presence of 140mM KCl. (C) Triplex formation using PPG-substituted TFOs at various time points. AG30, A6G30 and A8G30 (10-8 M) were incubated with end-labeled target duplex (10-10 M) for the indicated times in standard triplex binding buffer (10 mM MgCl2/no K+).

An official website of the United States government
Here's how you know
Official websites use .gov
A
.gov website belongs to an official
government organization in the United States.
Secure .gov websites use HTTPS
A lock (
) or https:// means you've safely
connected to the .gov website. Share sensitive
information only on official, secure websites.
