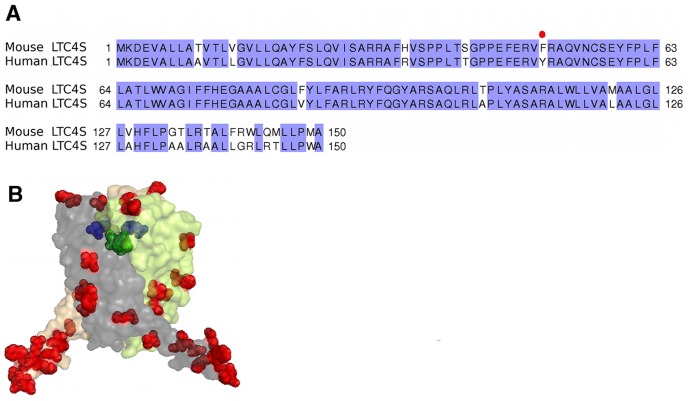
Figure 2. Comparison of human and mouse LTC4S enzymes.
A. Amino acid sequence alignment of human and mouse LTC4S generated with the program ClustalW. Species differences are highlighted in white. B. Mapping the amino acid differences (in red) between mouse and human trimeric LTC4S structures. The active site in one monomer is depicted with a bound GSH (green). In blue is the Phe50Tyr exchange positioned close to the active site.

