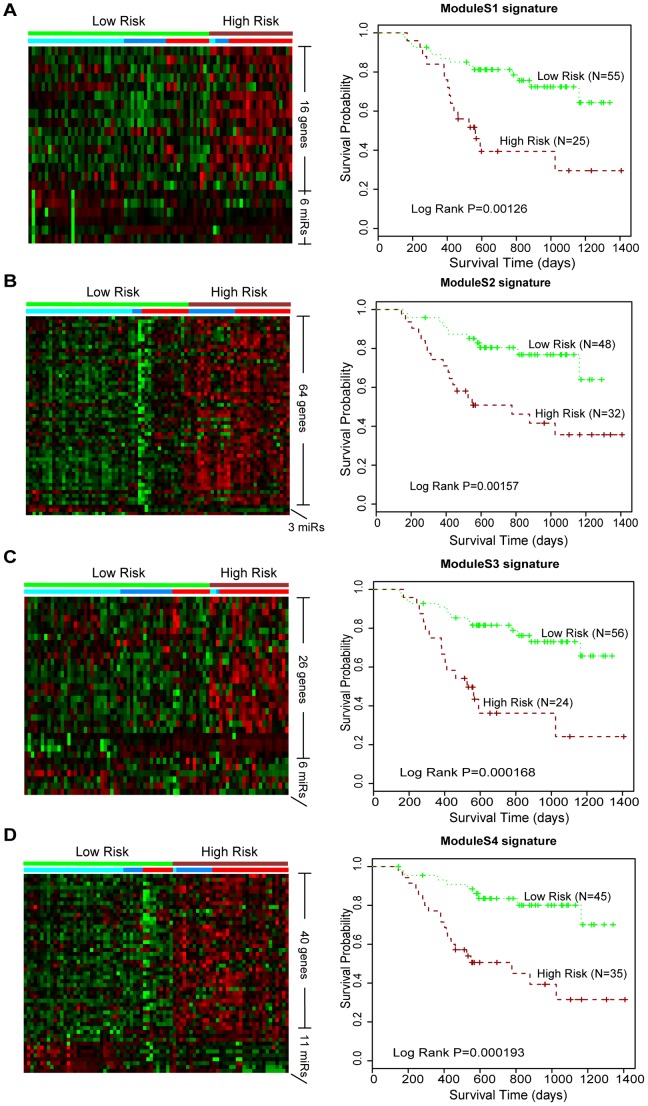
Figure 3. Module signatures predict glioma patient clinical outcome.
(A-D). Four sub-modules (moduleS1-S4). K-mean clustering representation of module signatures in the 80 glioma patients of the testing set. The columns represent tumor samples and rows represent genes and miRNAs in corresponding module. Red indicates high relative expression levels, whereas green low levels. Horizontal bars above the heat map indicate the grade status and class of the patient (cyan, deepblue and red box indicated grade II, III and IV; green and darkred box indicated low-risk and high-risk class). The low-risk and high-risk groups were derived from K-mean clustering (K = 2) and estimated by Kaplan-Meier survival analysis. P-values were calculated by the log-rank test.

