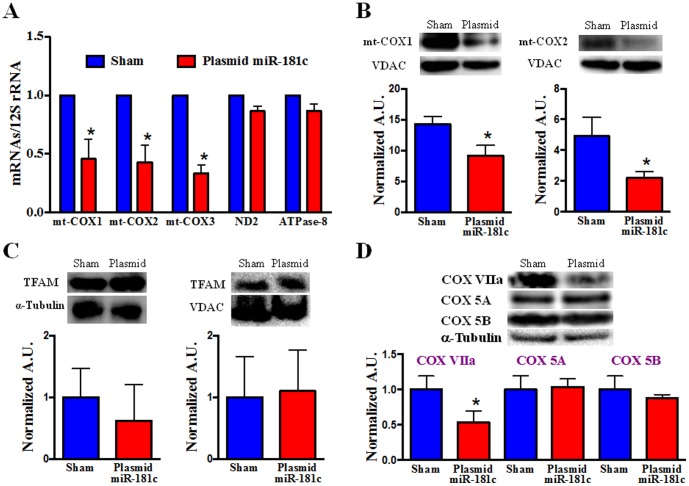
Figure 5. Mitochondrial Complex IV Remodeling after miR-181c Treatment.
(A) qPCR data show that overexpression of miR-181c significantly reduces the mRNA levels of all mitochondrial complex IV genes with 3 weeks treatment. The treatment protocol has no effect on other mitochondrial genes, such as ND2 (complex I) and ATPase 8 (complex V). Content of mRNA was first normalized to 12S rRNA, a mitochondrial gene, as 12S rRNA expression did not change with miR-181c overexpresssion. Then we normalized the data to the sham group. *p<0.05 vs. sham (n = 6). (B) Western blot shows that miR-181c overexpression significantly reduces the protein content of both mt-COX1 and mt-COX2. VDAC was used as a loading control. The data were normalized to the sham group. *p<0.05 vs. sham (n = 6). (C) Western blot shows that miR-181c overexpression has no effect on Transcription Factor A, Mitochondria (TFAM), either in the total heart homogenate (left panel) or the heart-derived mitochondrial fraction (right panel). TFAM plays an important role in mitochondrial gene transcription, by activating 3 different promoter regions in the D-loop area of the mitochondrial genome. TFAM also translocates from the cytosol to the mitochondria as part of the mitochondrial gene transcription process. α-tubulin (for total heart homogenate) and VDAC (mitochondrial fraction) were used as loading controls. The data were normalized to the sham group (n = 3). (D) Western blot shows the changes of other isoforms of mitochondrial respiratory chain complex IV. We have observed a significant decrease in the protein content of COX VIIa in the miR-181c overexpression groups, but no effect on COX 5A and COX 5B. α-tubulin was used as the loading control. The data were normalized to the sham group (n = 3).

