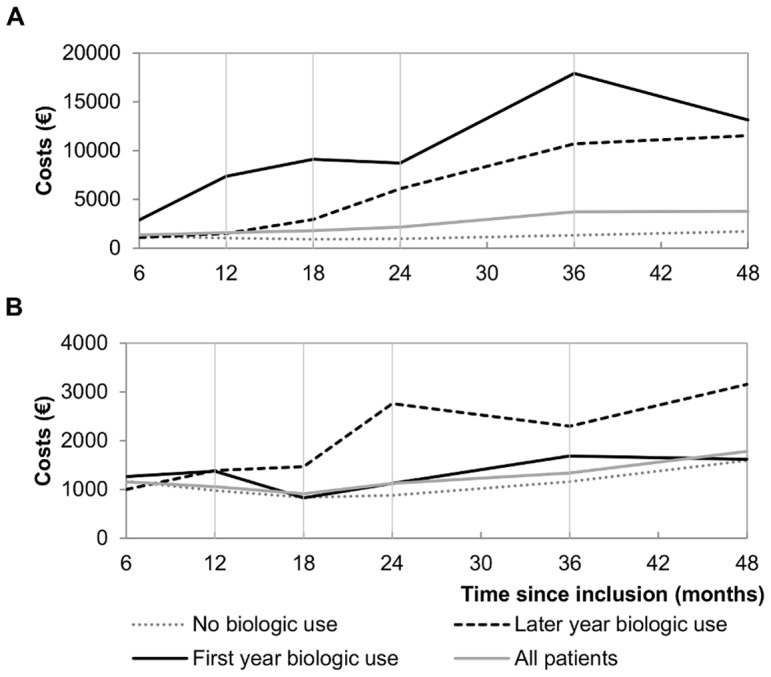
Figure 2. Mean costs per period according to treatment strategy.

(A) Mean total costs according to treatment strategy; (B) Mean other health resource use costs according to treatment strategy.

(A) Mean total costs according to treatment strategy; (B) Mean other health resource use costs according to treatment strategy.