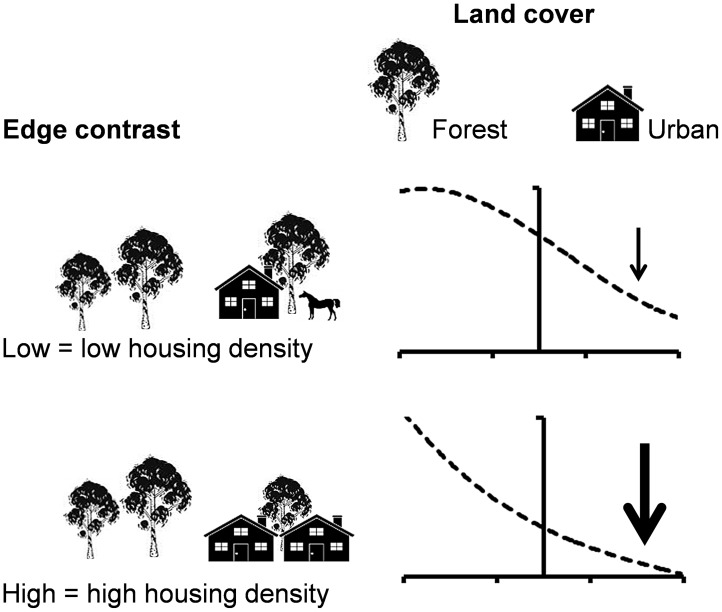
Figure 1. Expected responses of arboreal marsupials according to edge contrast and land cover in south-eastern Australia.
Graphs show the predicted trajectory of the animal abundance (dashed line) in adjacent habitats. The vertical line in each graph represents the boundary between two habitat patches. Arrows represent direction and magnitude of the predicted response with increasing distance from the urban boundary by each combination of edge contrast and land cover.

