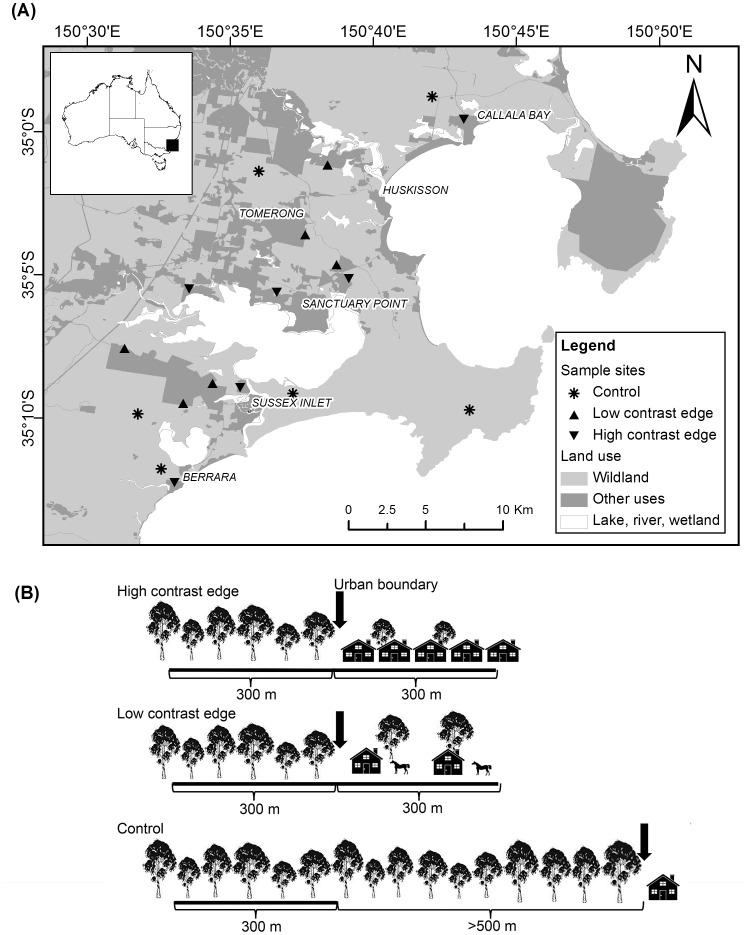
Figure 2. Study area, sites and diagram of transect placement for spotlighting surveys in south-eastern Australia.
(A) Study area and sites of spotlight surveys in south-eastern Australia. (B) Diagram of the transect placement for spotlighting surveys in each edge contrast. At each of the high and low contrast edges a 300 m transect was established from the urban boundary into the forest and another 300 m transect was established from the urban boundary into the urban area. Control sites included a 300 m transect within a forest and were >500 m away from other land use. Arrows indicate the urban boundary.

