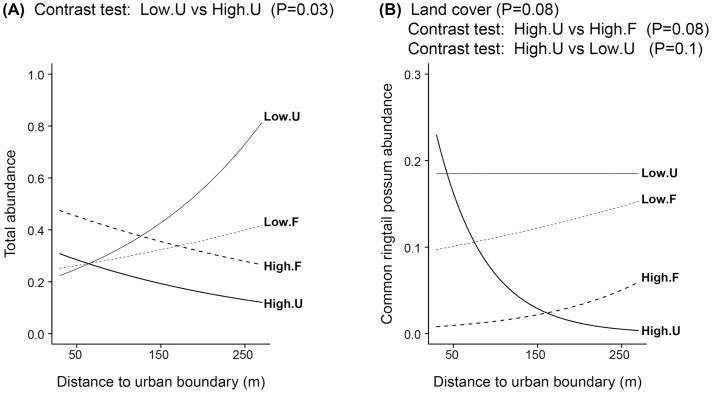
Figure 3. Predicted mean abundances per 100 m spotlight transect according to the distance to the urban boundary from Generalized Linear Mixed Models.
(A) Total abundance of arboreal marsupials and (B) common ringtail possum abundance. Codes of edge contrasts: High = high housing density; Low = low housing density. Codes of land cover: F = forest; U = urban. Estimated values were predicted for a single spotlighting pass. Significant P-values of the relevant variables in the GLMMs and significant contrast tests are shown on the top of each graph.

