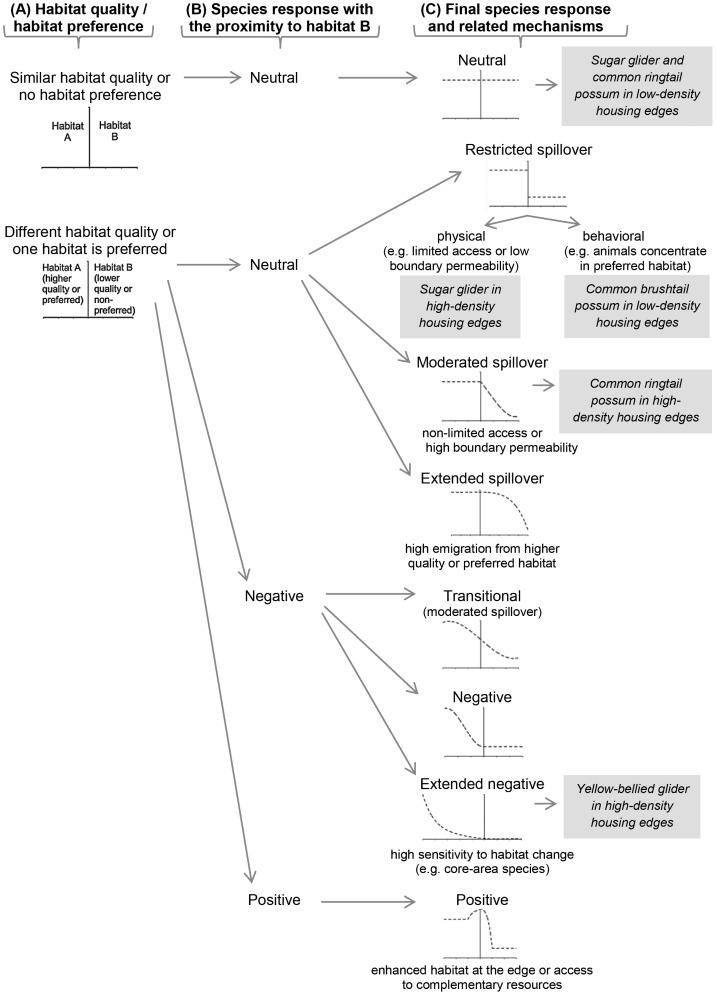
Figure 6. New predictive model of edge effects in animals.
Columns indicate three consecutive steps to predict the final animal response. Graphs show the predicted abundance of a species (dashed line) in adjacent habitats. The vertical line in each graph represents the boundary between two habitat patches. (A) The first step in the model proposes both habitat quality and habitat preference defining the initial response between two adjacent habitat patches. (B) The second step identifies three kinds of animal responses according to the proximity of the adjacent habitat. (C) The last step outlines the final response trajectory and related mechanisms modifying the response. Mechanisms modifying the response trajectory were related to species attributes and behavior (e.g. access to adjacent patch, avoidance to emigrate from preferred habitat, sensitivity to habitat change), population dynamics (e.g. density-dependence driving emigration), and patch attributes (e.g. permeability to emigration). Text boxes show the observed responses by each species in different edge contrasts in our study.

