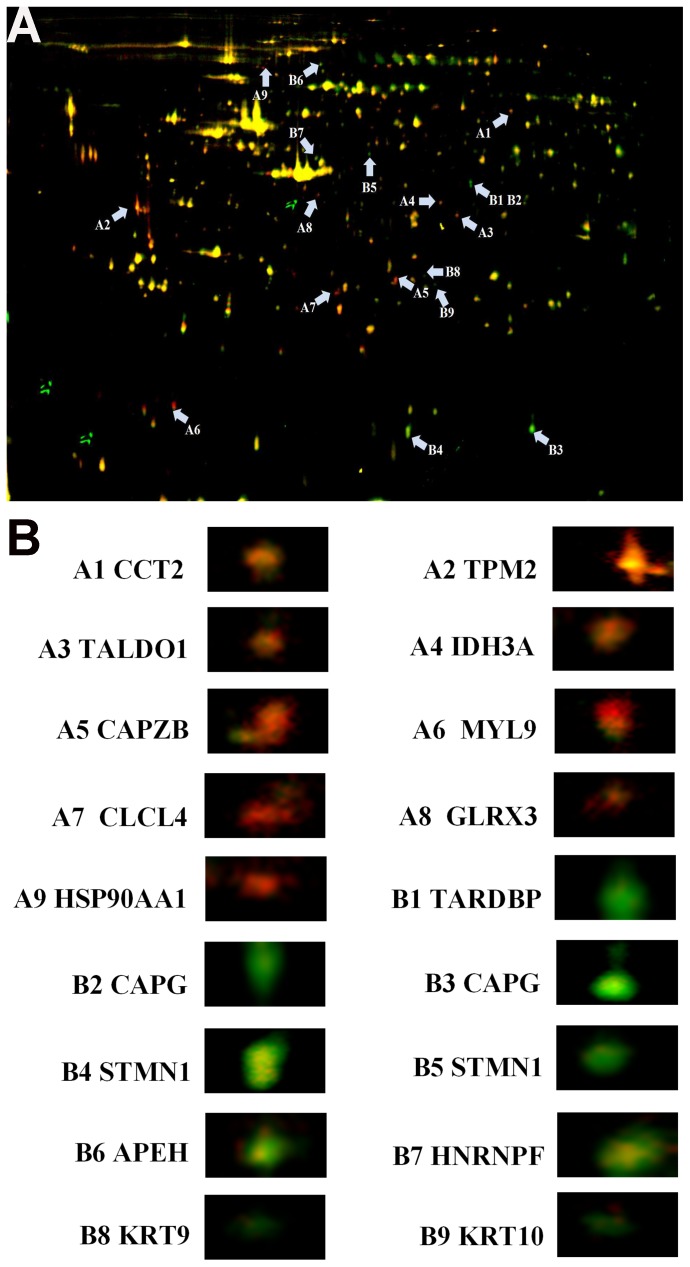
Figure 4. Changes in protein expression between DPSCs and CDPSCs.
A The merge of Cy3, Cy5 and Cy2. Distribution of 18 differentially expressed protein spots in fluorescence difference gel electrophoresis gels. Protein spots are indicated (arrows). B Enlarged images of the differentially expressed protein spots in DIGE analysis.

