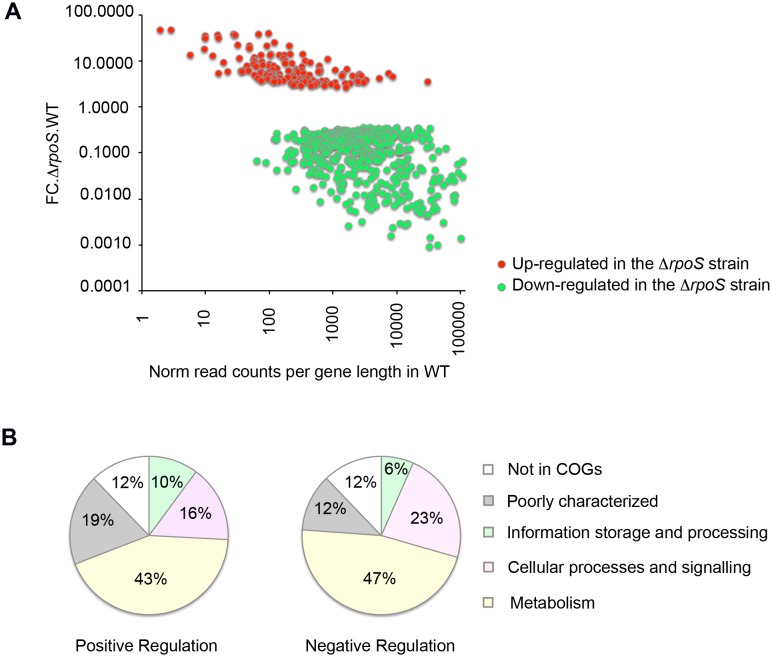
Figure 1. Directional RNAseq data analyses.
(A) Relative expression level and σS-dependency of σS-dependent genes (p<0.001). The x axis shows reads counts in the wild-type strain VF7969 normalized to the lenght of the gene. The y axis shows the fold change in the expression levels of the gene in the ΔrpoS strain VF9356 compared to the wild-type strain (as reported in Dataset S2). Red and green dots represent genes negatively and positively controlled by σS respectively. (B) Functional categories of σS-controlled genes (p<0.001). Genes controlled by σS are grouped according to their functional categories in the COG database (detailed COG assignments are given in Dataset S2). The relative occurrence of genes belonging to each category in the set of genes positively controlled by σS (left pie chart) and negatively controlled by σS (right pie chart) is shown. Some of the genes do not currently have a COG functional category assignment (here represented as not in COGs). Note that some genes have multiple COG category assignments (Dataset S2).

