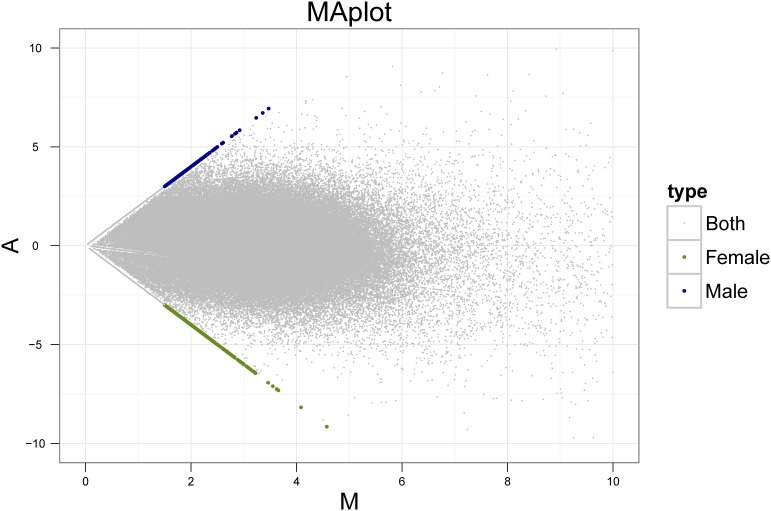
Figure 4. Distinctly sex-biased sequences in the genome of Asparagus officinalis.
Let C1 and C2 denote the counts of reads mapped to a specific scaffold obtained from male and female samples, respectively. Then we define M = (C1+C2)/2, and A = C1–C2. Blue and green dots represent distinctly 248 male-biased and 553 female-biased sequences, respectively, while grey dots represent sequences which have similar abundance between male and female genomes.

