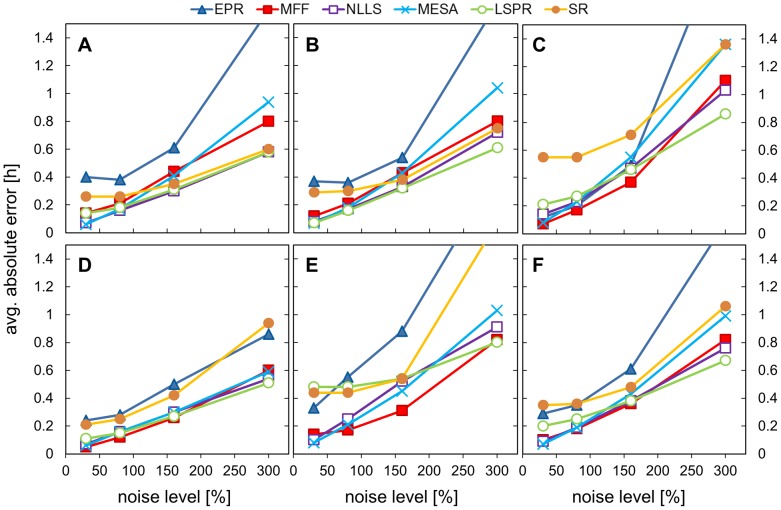
Figure 3. Impact of increasing levels of uniform noise on absolute error.
Data sets with different noise levels (30%, 80%, 160%, 300%) were analysed using all the methods and the absolute error is plotted. The absolute error is defined as the absolute value of the difference between calculated period and the expected value (24.08 for asym. signal and 24 h for the others). Data sets were created by adding noise of specific level to the hourly-sampled template of 3 days duration. The templates were: A) cosine data, B) pulse data, C) double pulse data, D) DNFL shoulder data, E) DNFL asymmetry data, F) aggregated results from all the shapes.

