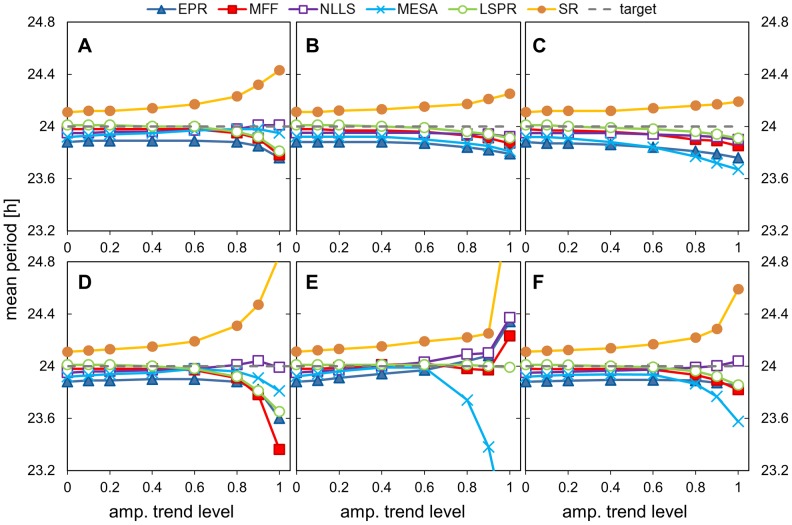
Figure 9. Impact of amplitude trends on period estimation.
Data sets with different levels of amplitude trend and different trend forms were analysed using all the methods and the mean period value is plotted. The amplitude trends were obtained by dampening the test data sets to the stated level using different trend shapes/envelopes. Dampening was applied to a standard pulse data set (5 days data, hourly sampled, 80% walking noise level, 24 h underlying period), using 5 different envelope shapes with increasing amplitude. The level of amplitude trend, i.e. the maximal reduction of the original signal, is denoted as: 0, no dampening; and for example 0.6 for lin. trend means that at the end of 5th day, the signal is reduced to 40% of its original value. The envelope shapes: A) exponential, B) linear, C) 1/3 parabola, D) 2/3 parabola, E) parabola, F) aggregated results from all the shapes.

