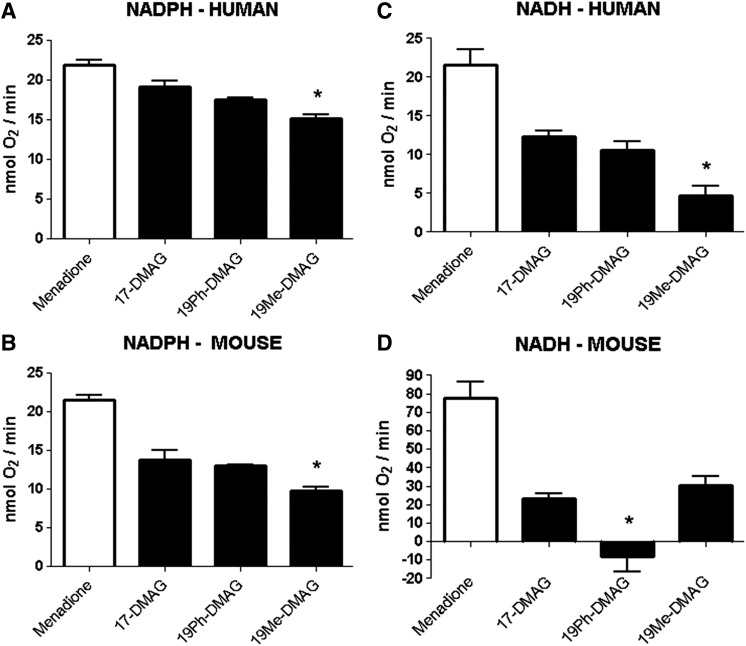
Fig. 3.
Redox cycling of BQAs and 19BQAs by mouse and human liver microsomes. The redox-cycling rates of BQAs and 19BQAs were determined in human (A and C) and mouse (B and D) liver microsomes supplied with NADH or NADPH by measuring the rates of oxygen consumption, as described in Materials and Methods. The naphthoquinone menadione was used as a positive control in these experiments. Data are expressed as mean ± S.E.M. (n = 3). *P < 0.05 versus parent BQA for each 19BQA (one-way analysis of variance with Tukey’s post-test).

