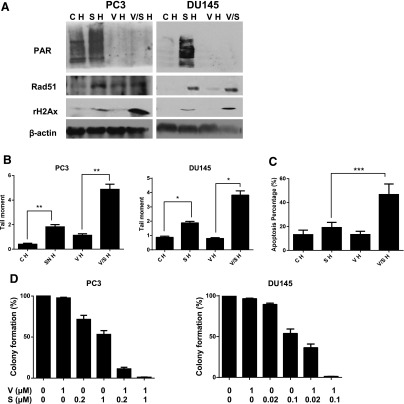
Fig. 3.
Veliparib enhances the antitumor effects of SN38 under hypoxia. (A) Western blots comparing levels of poly(ADP) ribose (PAR) and γ-H2AX in treated and untreated cells under hypoxia (H). CH, untreated control; SH, SN38; VH, veliparib; V/SH, veliparib plus SN38. (B) Neutral comet assay comparing DNA damage/tail moment in treated and untreated cells under hypoxia. The tail moment (y-axis) incorporated measurements of both the smallest detectable size of migrating DNA (reflected in the comet tail length) and the number of relaxed/broken pieces (represented by the intensity of DNA in the tail). Each column represents the mean and S.E.M. of tail moments of 50 cells. (C) Percentage of apoptosis as detected by flow cytometry in treated and untreated PC3 cells under hypoxia. (D) Clonogenic assay comparing the effects of hypoxia and 16-hour drug treatment on colony formation of PC3 and DU145 cells. The colony numbers in untreated controls were set as 100%. The colony numbers of each treatment group were divided by those of untreated control, and the percentages were reflected in y-axes. β-Actin was used as the loading control. Three replicates were performed for each experiment. Each column represents the mean and S.E.M. of three independent experiments. C, untreated control; H, hypoxia; S, SN38; V, veliparib; V/S, veliparib plus SN38. *P < 0.05; **P < 0.01; ***P < 0.001.

