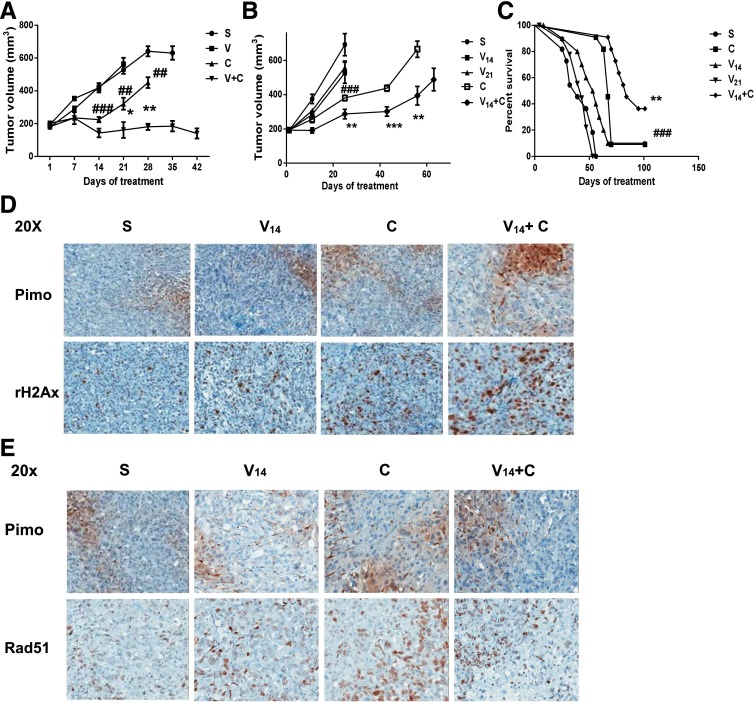
Fig. 4.
Veliparib enhances DNA damage and the antitumor effects of CPT-11 in vivo. (A) Growth curves for PC3 mouse xenografts treated with schedule A as described in Results. C, CPT-11; S, saline control; V, veliparib; V + C, veliparib plus CPT-11 combination. For each treatment group, the growth curve terminated on the day when the first xenograft in the group reached the 1000-mm3 size. Each tumor volume data point represents the mean and S.E.M. of eight mice. Significant data points were labeled with # in the CPT-11 versus saline comparison and labeled with * in the valiparib + CPT-11 versus CPT-11 comparison. (B) Growth curves for the PC3 mouse xenografts treated with schedule B as described in Results. Each tumor volume data point represents the mean and S.E.M. of 10 mice. Significant data points were labeled with # in the CPT-11 versus saline comparison and labeled with * in the valiparib + CPT-11 versus CPT-11 comparison. (C) Survival curve for the PC3 mouse xenografts treated with schedule B. The median survival of each treatment group was compared, and the log-rank test was used for survival rate analysis. (D) Comparison of IHC positivity and distributions of γ-H2AX (brown staining, lower panels) and hypoxia/pimonadazole (brown staining, upper panels) among PC3 xenograft sections treated with schedule B. (E) Rad51 (brown staining, lower panels) was detected in both pimonidazole-positive (brown staining, upper panels) and pimonidazole-negative areas on the PC3 xenograft IHC sections treated with schedule B. **/##P < 0.01; ***/###P < 0.001.

