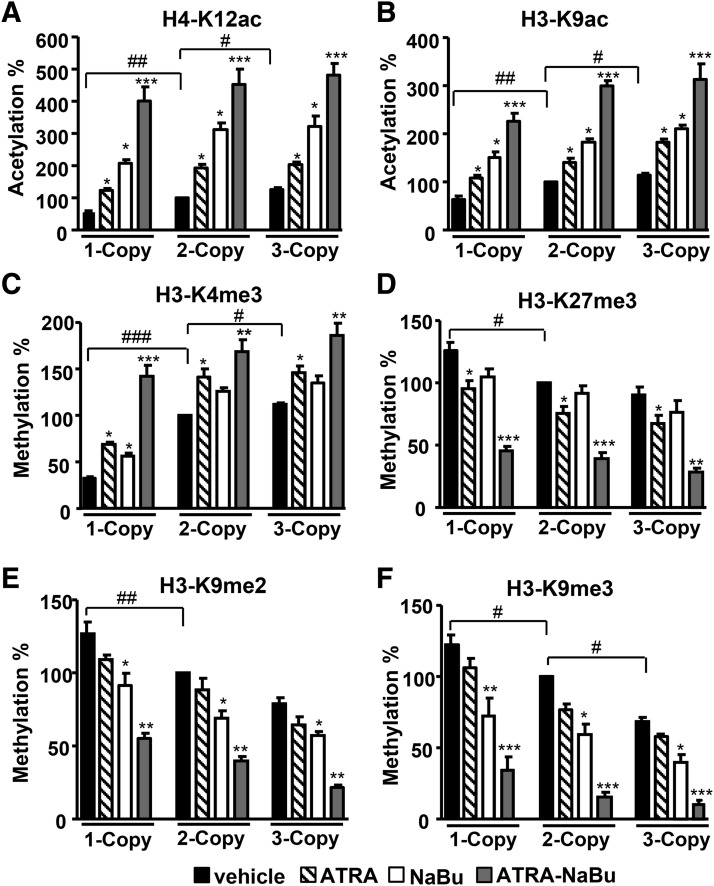
Fig. 3.
Quantitative analysis of renal H3 modifications in ATRA- and NaBu-treated Npr1 gene-targeted mice. Renal protein expression of H4 and H3 modifications H4-K12ac (A), H3-K9ac (B), H3-K4me3 (C), H3-K27me3 (D), H3-K9me2 (E), and H3-K9me3 (F) at specific lysines was done by the EpiQuik quantification kit from EpiGentek. Bar represents the mean ± S.E. of three independent experiments. *P < 0.05; **P < 0.01; ***P < 0.001 (vehicle-treated versus drug-treated same group); #P < 0.05; ##P < 0.01; ###P < 0.001 (1- or 3-copy versus 2-copy); n = 7 mice per group.

