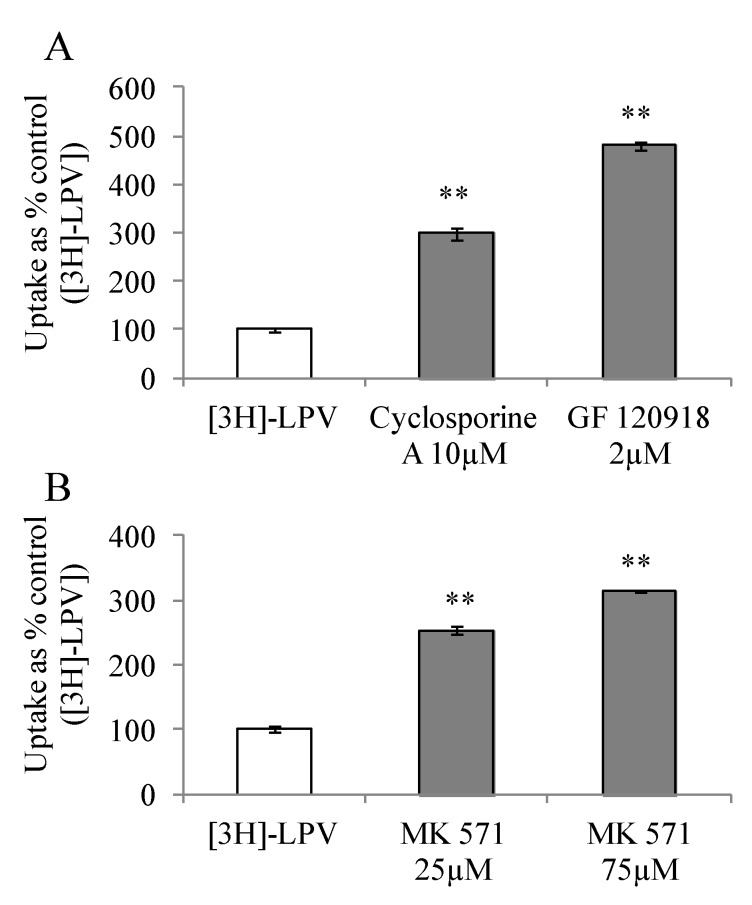
Figure 2.
(A) Cellular uptake of [3H]-LPV in (A) MDCK-MDR1 cells in absence and presence of cyclosporine A (10 μM) and GF 120918 (2 μM) and (B) MDCK-MRP2 cells in absence and presence of MK 571 (25 and 75 μM) in DPBS (pH 7.4) at 37 °C. Each data point is expressed as mean ± standard deviation (n=4). Uptake is expressed as percentage of control ([3H]-LPV). Asterisk (**) represents significant difference from the control (p < 0.01).

