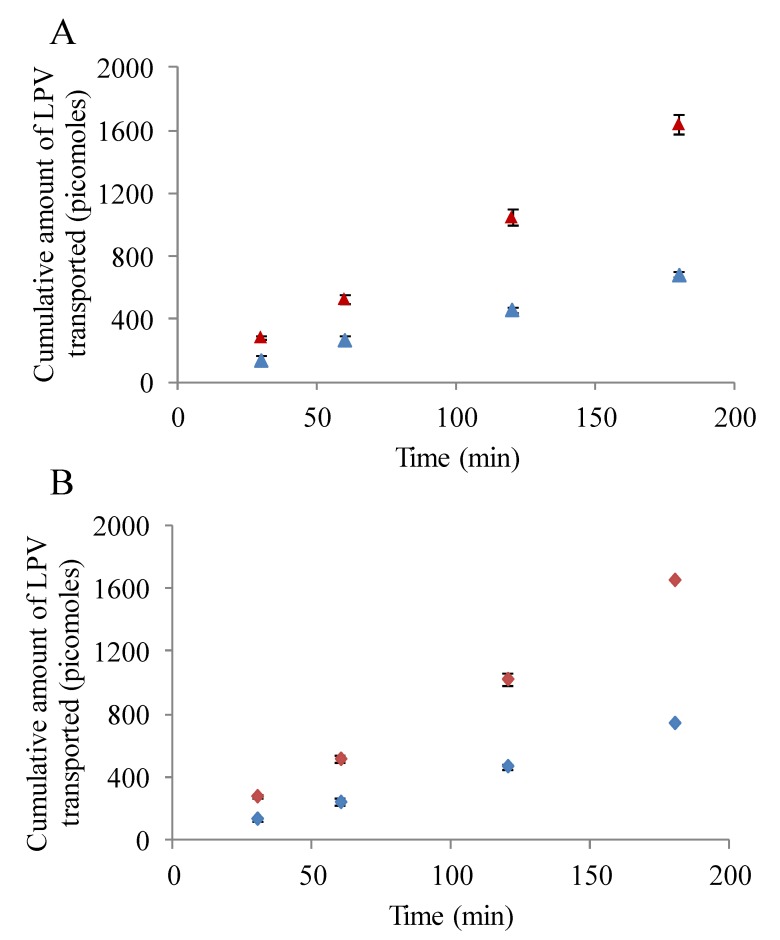
Figure 5.
(A) Transepithelial bidirectional transport of LPV (25 µM) across MDCK-MDR1 cells in DPBS (pH 7.4) at 37 °C for 180 min. (Blue ▲) represent apical to basolateral transport (A–B) and (Red ▲) represents basolateral to apical transport (B-A). (B) Transepithelial bidirectional transport of LPV (25 µM) across MDCK-MRP2 cells in DPBS (pH 7.4) at 37 °C for 180 min. (Blue ♦) represent apical to basolateral transport (A–B) and (Red ♦) represents basolateral to apical transport (B-A). Each data point is expressed as mean ± standard deviation (n = 4).

