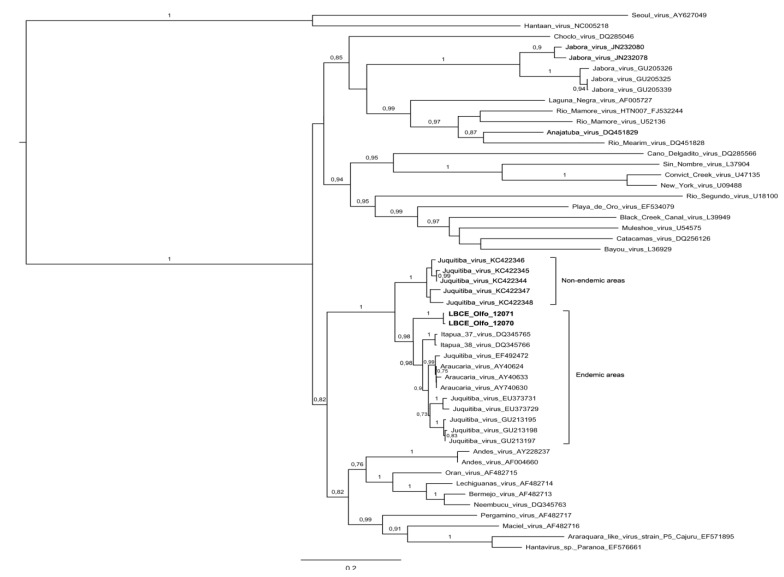
Figure 2.
Phylogenetic relationships among hantaviruses based on a Bayesian analysis of genetic distances generated from comparisons of the nucleocapsid protein gene partial sequences (935 nt). The scale bar indicates a sequence divergence of 0.2. The numerical value at the node indicates the posterior probability (pp) replicates that supported the interior branch. The branch labels include GenBank® accession number and viral species or strain (Access number: Genbank® LBCE_Olfo_12070-KF913849, LBCE_Olfo_12071-KF913850).

