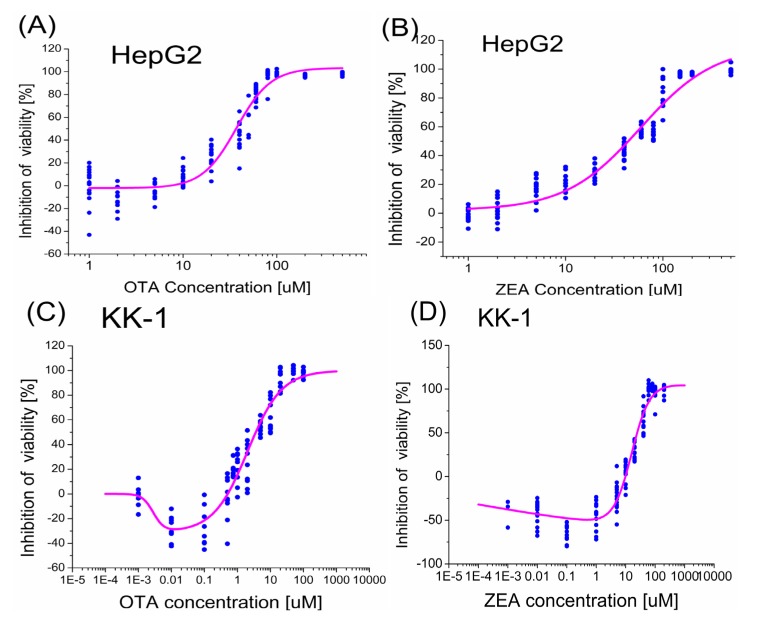
Figure 1.
Dose-response curves for individual toxins on the inhibition of cell survival fitted by non-linear regression. The cells were exposed to mycotoxins for 24 h and the viabilitywas determined by the WST-8 assay. Inhibition of cell viability after exposure to OTA (A) and ZEA (B) of HepG2 cells, and OTA (C) and ZEA (D) of KK1 cells are shown. All experiments are repeated for at least three times in four replicates. Ochratoxin A (OTA) and Zearalenone (ZEA) inhibit the viability of HepG2 cells and KK-1 cells in a dose-dependent manner.

