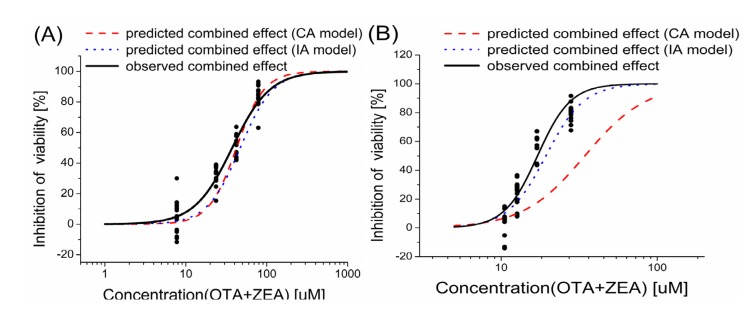
Figure 2.
Comparison of observed and predicted cell death after exposure to mixtures of OTA and ZEA. Components are mixed equieffectively in the ratio of their individual EC1, EC10, EC25 and EC50 values. EC1, EC10, EC25 and EC50 stand for concentrations causing 1%, 10%, 25% and 50% of cytotoxicity. The predicted dose-response curves of the mixture were fitted with the data calculated from CA and IA models. All curves were fitted by the logistic function. (A) HepG2 cells; (B) KK-1 cells.

