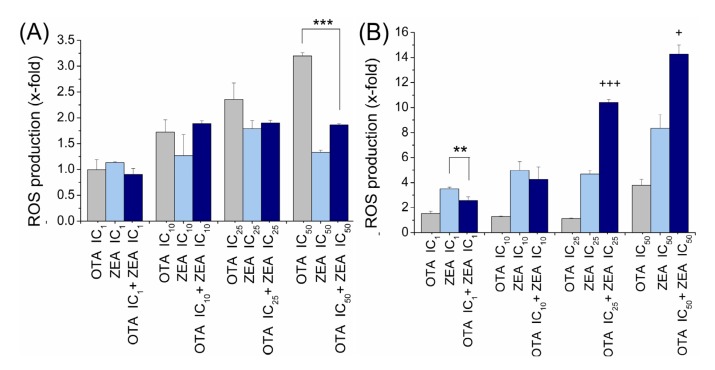
Figure 3.
Individual and combined effects of OTA and ZEA on the intracellular ROS production. Total intracellular ROS were measured using DCFH-DA by flow cytometry in HepG2 cells (A) and KK-1 cells (B) exposed to OTA, ZEA or mixture (OTA + ZEA) for 24 h. The relative DCF-fluorescence intensity (fold) in treated cells is shown. Bars represent the mean ± SD. “*” indicates that the value of the mixture group is significantly lower than the individual mycotoxin group, showing antagonistic. “+” indicates that the value of the mixture group is significantly higher than the value of adding the two individual groups’ value together, showing synergistic. (*, +, p < 0.05; **, ++, p < 0.01: ***, +++, p < 0.001).

