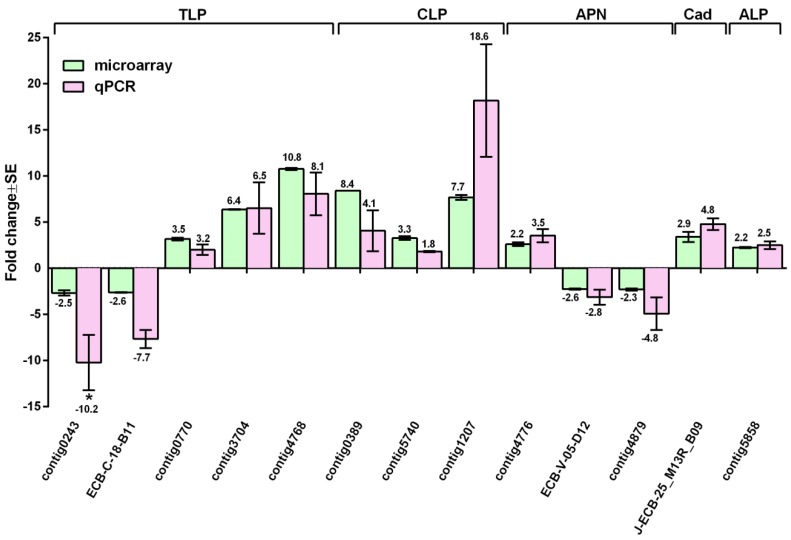
Figure 2.
Validation of microarray data using RT-qPCR. Microarray (spotted bar) and RT-qPCR (outlined diamond bar) analyses of 13 differentially regulated transcripts, sequentially, including those encoding putative trypsin and trypsin-like serine protease transcripts (TLP) (EST ID: contig [4786], contig [3704], contig [0770], contig [0243], ECB-C18-B11), chymotrypsin and chymotrypsin-like serine protease transcripts (CLP) (EST ID: contig [0389], contig [1207], contig [5740]), aminopeptidase (APN) (EST ID: contig [4776], contig [4879], ECB-V05_D12), cadherin (Cad) (EST ID: J-ECB-25B09), and alkaline phosphatase (ALP) (EST ID: contig [5858]). The fold change of each transcript in the microarray (p-value < 0.05, and fold change cut off ≥2 folds) and RT-qPCR analyses (p-value ≤ 0.05) are marked on the top of each column. The symbol “*” indicates that RT-qPCR of contig [0243] did not show significant difference between the Cry1Ab protoxin and no protoxin treatments (p > 0.05).

