
Figure 1.
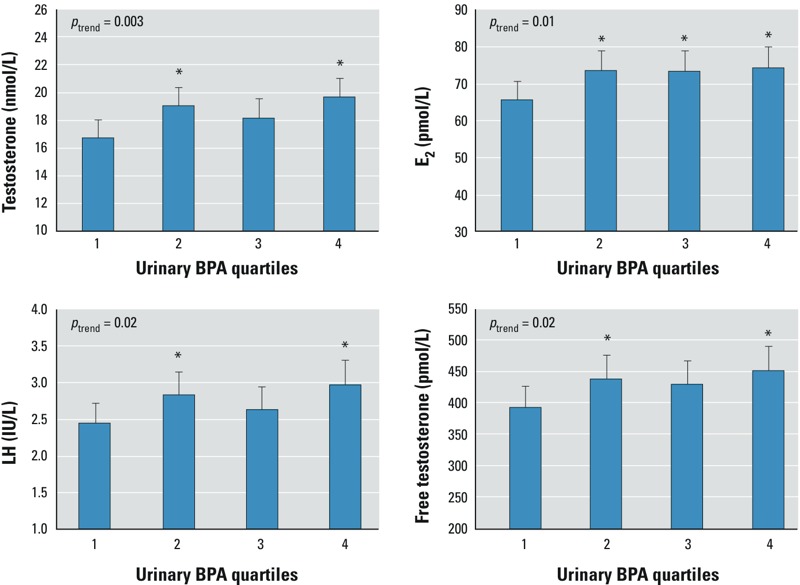
Selected reproductive hormones by quartiles of osmolality-adjusted urinary BPA concentration in 303 healthy, young men from the general population. Bars correspond to estimated median hormone values after adjusting for BMI, smoking, and time at day of blood sampling. Whiskers indicate 95% CIs. Range of BPA quartiles [ng/mL(osm)]: 1st, LOD–2.17; 2nd, 2.18–3.70; 3rd, 3.71–6.44; 4th, > 6.44. ptrend, p-value for linear trend across quartiles of BPA. Note that the y-axes do not start at zero. *p < 0.05, compared with 1st BPA quartile.