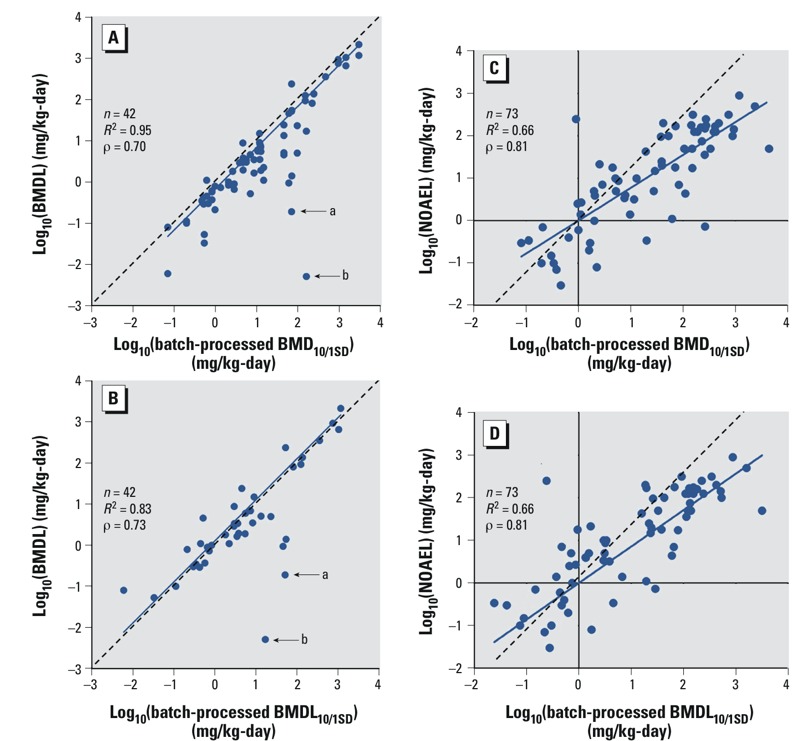
Figure 2.

Correlations of batch-calculated BMDs and BMDLs with BMDLs (A,B) and NOAELs (C,D) as reported in human health risk assessments. R2 values represent squared Pearson correlations. ρ Values represent Spearman correlations. Dotted line represents the regression line through the origin. Solid line represents the best-fit line. “a” denotes dichloromethane values; “b” denotes trichloroethylene values.
