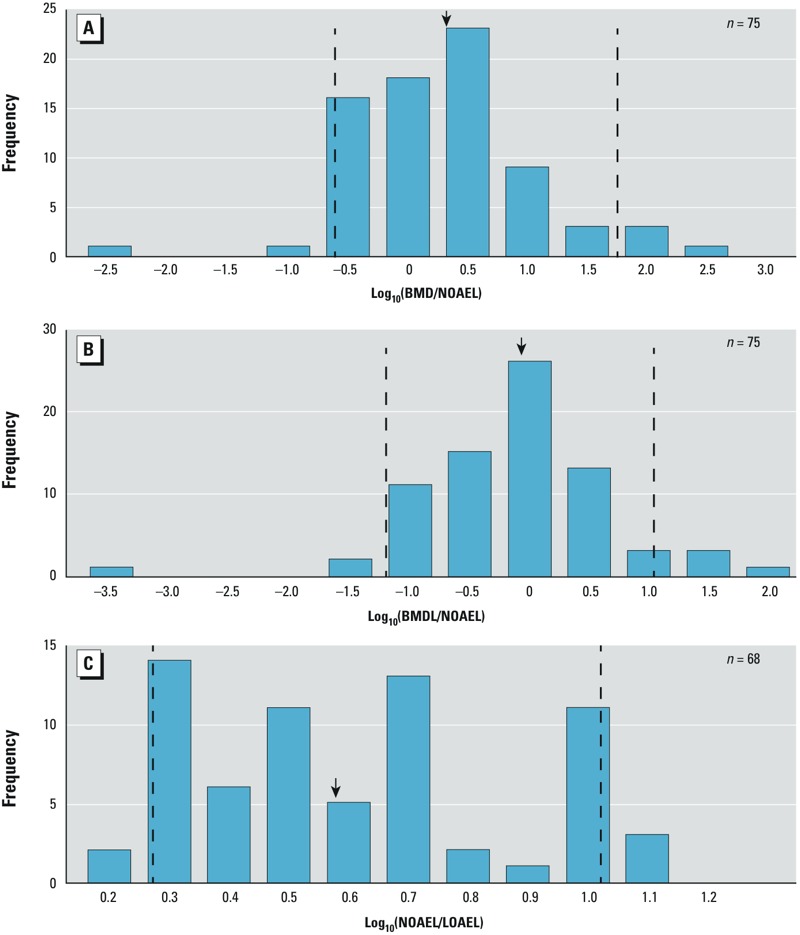
Figure 3.

Histograms of log-transformed ratios of batch-calculated BMDs to NOAELs (A), BMDLs to NOAELs (B), and LOAELs to NOAELs (C). The y-axis shows the frequency counts; the x-axis shows the magnitude of the ratio; the dashed lines indicate the 5th and 95th percentiles of the distribution; and the arrows indicate median values.
