Figure 5.

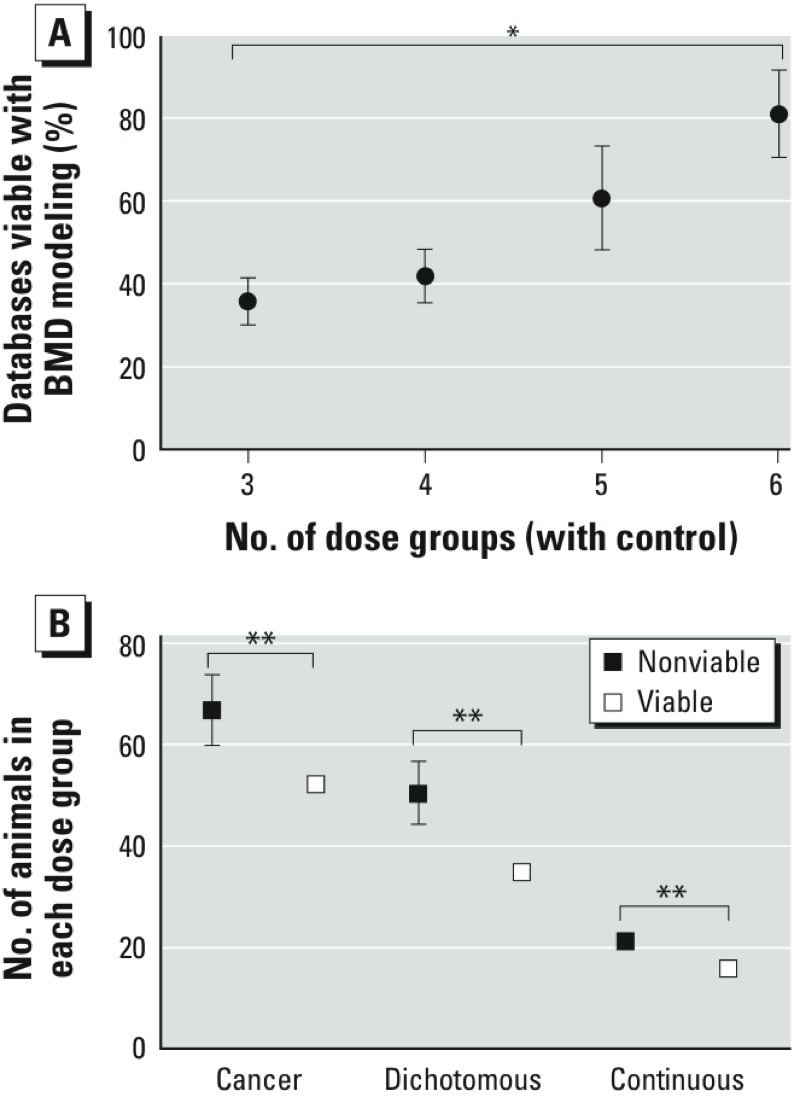
Relationship of Viable BMD models to (A) the number of dose groups, (B) number of animals in each dose group. Error bars indicate SEs. *ptrend < 0.01. **p < 0.001, between group means.

Relationship of Viable BMD models to (A) the number of dose groups, (B) number of animals in each dose group. Error bars indicate SEs. *ptrend < 0.01. **p < 0.001, between group means.