
Figure 3.
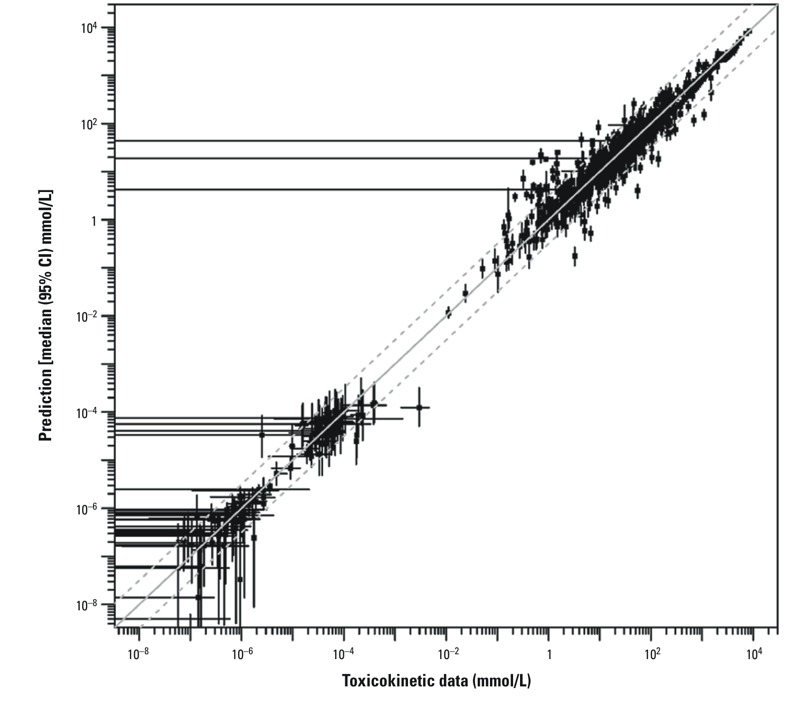
Global evaluation of model fit, comparing toxicokinetic data (x-axis) and PBPK model predictions (y-axis), each with 95% CIs (error bars). In some cases, the confidence interval on the data included 0, as indicated by horizontal error bars that extend all the way to the left. The solid gray diagonal line indicates where data and predictions are equal, and the dashed lines indicate where they are within 3-fold.