
Figure 5.
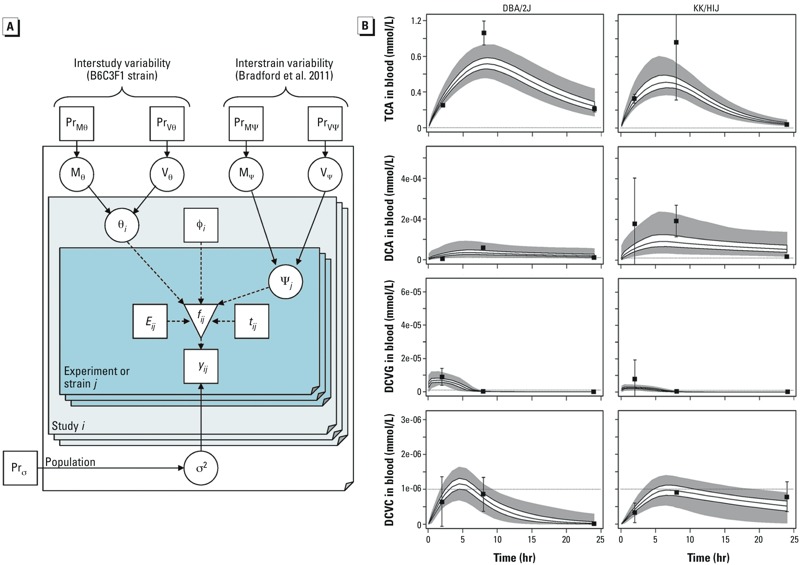
(A) Hierarchical population statistical model for PBPK model uncertainty and variability. Square nodes represent fixed or observed quantities, circle nodes represent uncertain or unobserved quantities, and the inverted triangle represents PBPK model outputs; solid arrows indicate a stochastic relationship represented by a conditional distribution [e.g., A→B means B ~ P(B|A)], whereas dashed arrows indicate a functional relationship [e.g., B = f(A)]. The population consists of studies i, each of which contains experiments or strains j, with exposure parameters Eij, and data yij collected at times tij. The PBPK model produces outputs fij. The difference between data and predictions is assumed to have a distribution with variance σ2, which is assigned a prior distribution (Pr). The PBPK model uses non–strain-specific parameters θi, measured covariates φi, and strain-specific parameters ψj. The parameters are each drawn from population distributions with mean Mθ or ψ and variance Vθ or ψ, each of which are in turn assigned prior distributions. (B) Comparison of data (data points with ± 1 SD error bars) and PBPK model predictions (solid lines represent interquartile range, gray area represents 95% CI) for two representative mouse inbred strains (data from Bradford et al. 2011). Dotted lines indicate the limits of detection.