
Figure 6.
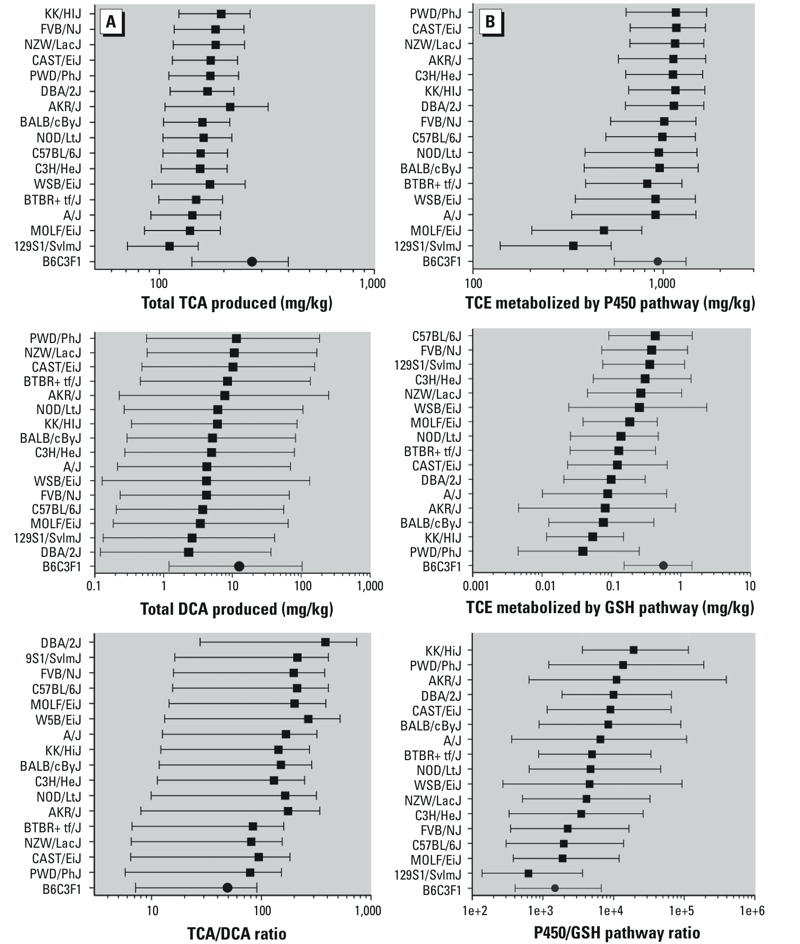
Predictions for TCE metabolites and metabolite fluxes across mouse strains (median and 95% CI). (A) TCA produced, DCA produced, and the ratio of TCA/DCA produced. (B) Flux of TCE metabolism through oxidation, flux through glutathione conjugation, and ratio of oxidation to glutathione conjugation. A solid circle is used for the “index” B6C3F1 strain, whereas solid squares are used for the other strains.