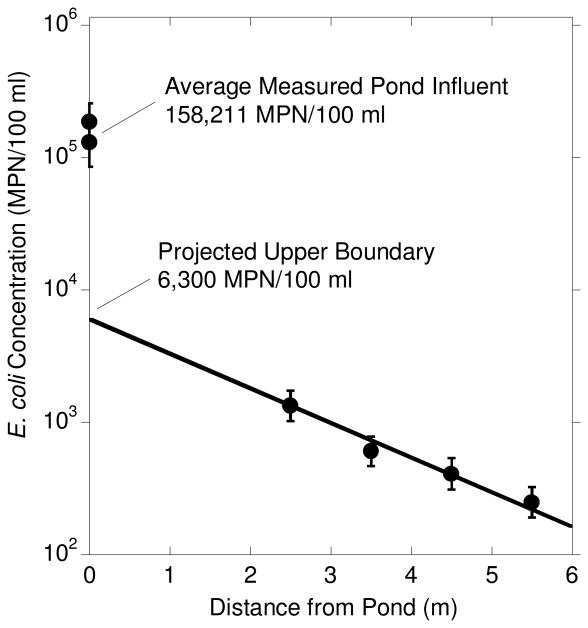
Figure 4.
Estimation of E. coli input concentration at upper model boundary 1.5 m below the base of Pond 1. Concentrations at distances >0 m were measured in shallow T1.1 wells on day three after artificial filling of Pond 1, when the plume had reached the outer well. Error bars represent 95% confidence intervals40.

