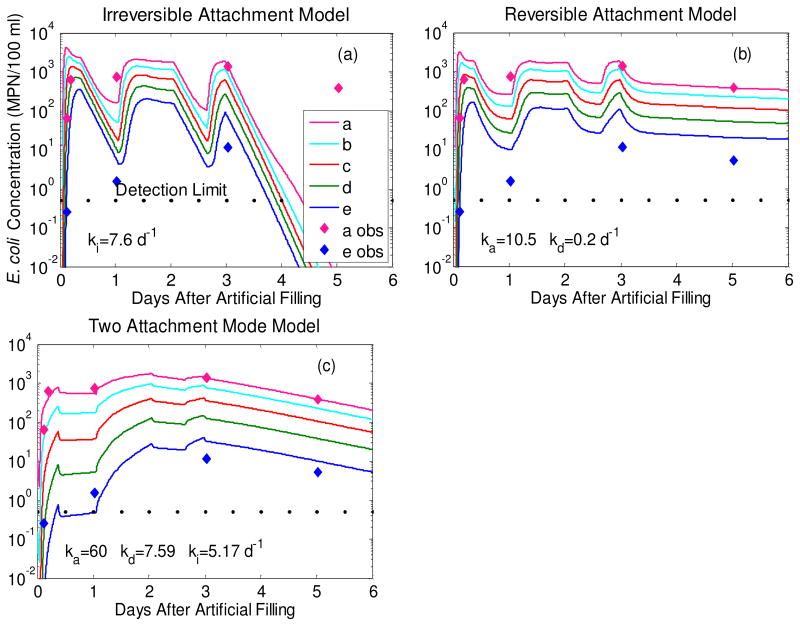
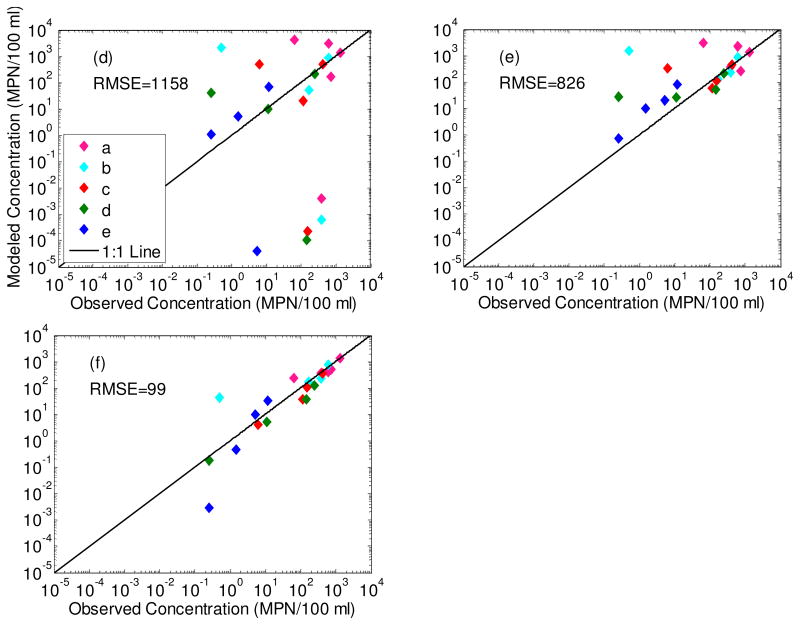
Figure 6.
Modeled breakthrough of E. coli in T1.1 shallow wells during the experimental period (a-c). Input concentration at the upper boundary of the model was 6,300 MPN/100 ml. The lower three panels represent observed versus predicted E. coli concentrations for each of the three model types with the root mean squared error (RMSE) (d-f).


