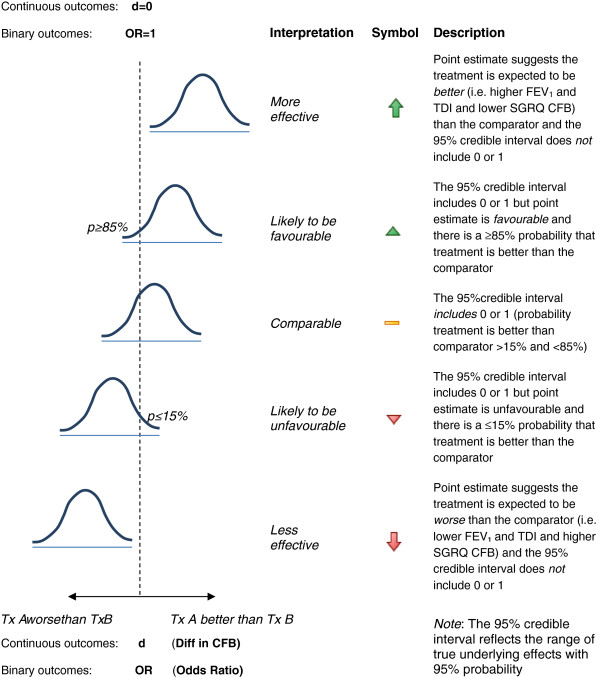
Figure 1.

Interpretation of the relative treatment effects resulting from the network meta-analysis for continuous and binary outcomes. CFB=Change from baseline; D=difference in CFB; FEV1=Forced expiratory volume; OR=odds ratio; SGRQ=St. George’s Respiratory Questionnaire; TDI=Transitional Dyspnoea Index; d=0 indicates that the dotted line is equal to a difference in CFB between the treatments of zero for continuous endpoints (i.e. no difference between treatments); OR=1 indicates that the dotted line is equal to an odds ratio of one for binary endpoints (i.e. no difference between treatments).
