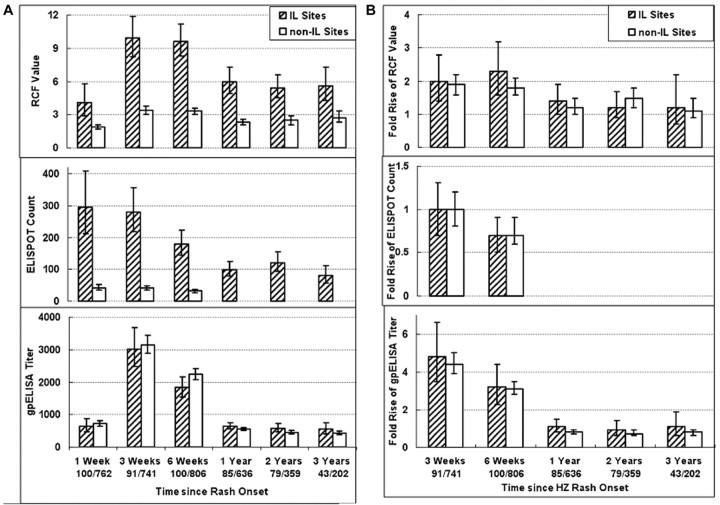
Figure 2.
Varicella-zoster virus (VZV)–specific immune responses over time in subjects with herpes zoster (HZ). A Bars indicate geometric means and 95% confidence intervals (CIs) for absolute responder cell frequency (RCF) values, measured as responder cells per 105 peripheral blood mononuclear cells (PBMCs); enzyme-linked immunospot (ELISPOT) counts, measured as spot-forming cells per 106 PBMCs; and titers for enzyme-linked immunosorbent assay against affinity-purified VZV glycoproteins (gpELISA), measured as gpELISA units per milliliter. Data for ELISPOT responses were not available in subjects from clinical sites at locations distant from immunology laboratories (ILs) (non-IL sites) beyond week 6 after the onset of HZ rash. RCF and ELISPOT values were significantly lower in subjects from non-IL than in those from IL sites (P<.05). B Bars indicate geometric means and 95% CIs of the fold change in value for each assay at the indicated time point relative to the value measured 1 week after HZ rash onset. Numbers indicate the numbers of subjects who contributed samples at each time point at IL or non-IL sites. Fold change comparisons are not provided for ELISPOT responses beyond week 6 after HZ rash onset, because of the lack of data in the subjects from non-IL sites. RCF and ELISPOT fold changes were similar in subjects from IL and non-IL sites

