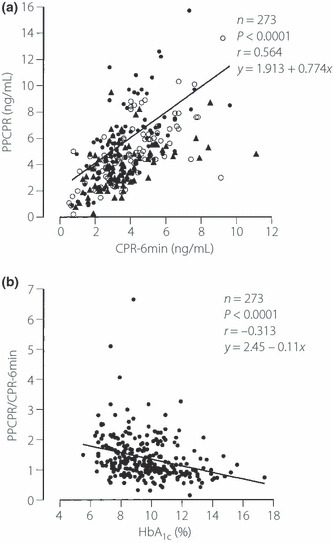
Figure 2.

Relationship between (a) C‐peptide immunoreactivity 6 min after intravenous injection of 1 mg glucagon (CPR‐6min) and 2‐h postprandial C‐peptide levels after breakfast (PPCPR) and (b) PPCPR/CPR‐6min and HbA1c. Black circles, HbA1c ≤ 8.5%; white circles, 8.6% ≤ HbA1c ≤ 10.3%, black triangles, 10.4% ≤ HbA1c
